
The three P&C venture-backed U.S. insurtech start-ups -- Lemonade, Metromile and Root -- finished 2018 with pretty good results. Quarterly growth was the slowest ever, but all three paid out in claims less than they collected in premium. All three start-up carriers have more work to do to achieve sustainable financials.
A year ago, when I started with my friend Adrian a public conversation about insurtech statutory results, the picture was ugly -- loss ratios well over 100%, an aggressive focus on price and promotional messages on company blogs that dismissed traditional measures of success in insurance.
Since the first post titled "5 Dispatches From Insurtech Island,” the conversation has shifted dramatically. Fast forward a year, and one founder said he “messed up an entire quarter” because premium growth turned negative, when in fact the company generated its best quarterly loss ratio ever. In the months since, several start-ups have hired top underwriting talent from their traditional competitors, showing that they increasingly recognize the value of traditional insurance skills.
 Skeptics point out that a quarter doesn’t mean much, that there’s a long way to go before reaching sustainability and that each additional point of loss gets harder to take out. True, but the increased focus this year on reducing losses and increasing prices is making a difference.
Here are the quarterly results:
Skeptics point out that a quarter doesn’t mean much, that there’s a long way to go before reaching sustainability and that each additional point of loss gets harder to take out. True, but the increased focus this year on reducing losses and increasing prices is making a difference.
Here are the quarterly results:
 I think – as already mentioned in the previous articles - these companies have strong management teams who could ultimately create valuable businesses. This will take several years, but all three companies are well-funded, even if the combination of statutory capital injections and operating losses consumes tens of millions in capital each year. (The Uber/Lyft model of growing rapidly while also incurring large losses is doubly penalized in insurance because carriers have to maintain statutory capital that increases with premium.)
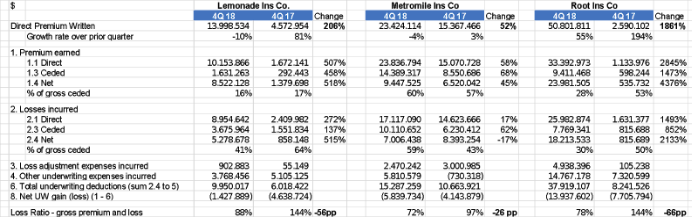
Here is a year-over-year comparison.
I think – as already mentioned in the previous articles - these companies have strong management teams who could ultimately create valuable businesses. This will take several years, but all three companies are well-funded, even if the combination of statutory capital injections and operating losses consumes tens of millions in capital each year. (The Uber/Lyft model of growing rapidly while also incurring large losses is doubly penalized in insurance because carriers have to maintain statutory capital that increases with premium.)
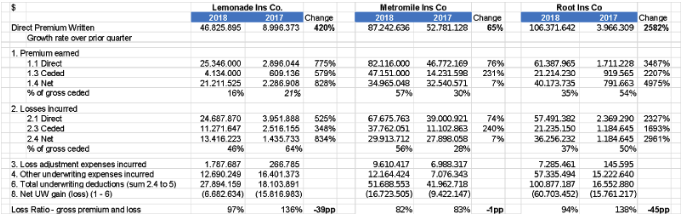
Here is a year-over-year comparison.
 The three companies have sold in the last 12 months between $40 million and $110 million, less than some of the early 2017 enthusiastic forecasts that Lemonade (for example) would hit $90 million of premiums by the end of 2017. In auto, I pointed out at my IoT Insurance Observatory plenary sessions that the pay-as-you-drive telematics approach seems to attract only the niche of customers that rarely use cars – maybe a growing niche, but not a billion-dollar business (in premium at least).
See also: 9 Pitfalls to Avoid in Setting 2019 KPIs
Loss Ratios
Loss ratios have all been below 100%, which is a great improvement from the 2017 performances. The quarterly dynamics show a positive trend, but these loss ratio levels are far from the U.S. market average for home insurance (Lemonade) and auto insurance (Root and Metromile).
While loss ratio is a fundamental insurance number – claims divided by premiums -- I've been asked how to normalize/adjust the loss ratio of a fast-growing insurtech company.
Imagine a fast-growing insurer with the following annual figures:
The three companies have sold in the last 12 months between $40 million and $110 million, less than some of the early 2017 enthusiastic forecasts that Lemonade (for example) would hit $90 million of premiums by the end of 2017. In auto, I pointed out at my IoT Insurance Observatory plenary sessions that the pay-as-you-drive telematics approach seems to attract only the niche of customers that rarely use cars – maybe a growing niche, but not a billion-dollar business (in premium at least).
See also: 9 Pitfalls to Avoid in Setting 2019 KPIs
Loss Ratios
Loss ratios have all been below 100%, which is a great improvement from the 2017 performances. The quarterly dynamics show a positive trend, but these loss ratio levels are far from the U.S. market average for home insurance (Lemonade) and auto insurance (Root and Metromile).
While loss ratio is a fundamental insurance number – claims divided by premiums -- I've been asked how to normalize/adjust the loss ratio of a fast-growing insurtech company.
Imagine a fast-growing insurer with the following annual figures:
 To measure efficiency, I prefer to use the two traditional components of the expense ratio:
Skeptics point out that a quarter doesn’t mean much, that there’s a long way to go before reaching sustainability and that each additional point of loss gets harder to take out. True, but the increased focus this year on reducing losses and increasing prices is making a difference.
Here are the quarterly results:
I think – as already mentioned in the previous articles - these companies have strong management teams who could ultimately create valuable businesses. This will take several years, but all three companies are well-funded, even if the combination of statutory capital injections and operating losses consumes tens of millions in capital each year. (The Uber/Lyft model of growing rapidly while also incurring large losses is doubly penalized in insurance because carriers have to maintain statutory capital that increases with premium.)
Here is a year-over-year comparison.
The three companies have sold in the last 12 months between $40 million and $110 million, less than some of the early 2017 enthusiastic forecasts that Lemonade (for example) would hit $90 million of premiums by the end of 2017. In auto, I pointed out at my IoT Insurance Observatory plenary sessions that the pay-as-you-drive telematics approach seems to attract only the niche of customers that rarely use cars – maybe a growing niche, but not a billion-dollar business (in premium at least).
See also: 9 Pitfalls to Avoid in Setting 2019 KPIs
Loss Ratios
Loss ratios have all been below 100%, which is a great improvement from the 2017 performances. The quarterly dynamics show a positive trend, but these loss ratio levels are far from the U.S. market average for home insurance (Lemonade) and auto insurance (Root and Metromile).
While loss ratio is a fundamental insurance number – claims divided by premiums -- I've been asked how to normalize/adjust the loss ratio of a fast-growing insurtech company.
Imagine a fast-growing insurer with the following annual figures:
- Premiums written: $10 million
- Premiums earned: $6 million
- Claims paid: $2 million
- Losses incurred but unpaid: $5 million
- Claims paid divided by premiums written: 20%
- Claims paid divided by premiums earned: 33%
- Claims paid and losses incurred divided by premiums written: 70%
- Claims paid and losses incurred divided by premiums earned: 117%
- Company A — flashy Start-up Insurance Co. uses outsourced call centers, bots, incessant Instagram ads, comparison rater websites, third-party claims administrators and a slick app. It sells one line of insurance, only personal, with low limits, and has no complicated old claims (yet). If your house burns down, you open an app and wait. The company has a low expense ratio, high acquisition costs and a high loss ratio.
- Company B — old Traditional Insurance Co. uses a mix of direct sales, captive agents and independent agents. Claims are handled mostly by agents and in-house staff. If your house burns down, your agent turns up with a reservation for a nearby hotel, billed directly to the insurer. The company sells 12 lines of insurance, including small commercial, and a wide range of products within each line, with bundling encouraged. The company has a high expense ratio, high acquisition costs, strong customer loyalty and losses less than the industry average.
To measure efficiency, I prefer to use the two traditional components of the expense ratio:
- General operating expense ratio = general operating expenses ÷ earned premiums
- Acquisition ratio = total acquisition expenses divided by the earned premiums (for high growth companies, it’s acceptable to do the division by written premium). This metric includes advertising, other marketing expenses, commissions and other distribution expenses. However, this number (like CAC) can be difficult to compare - for example, are fixed marketing expenses included or excluded? And the economics of customer loyalty are different between direct (where initial CAC is high but renewal is low) and agent sales (where initial CAC is lower and variable but renewal commissions are significant).