

For insurers that underwrite commercial properties, crime risk data can often be overlooked or under-prioritized in comparison with other hazard data. In the P&C industry, we’re often quick to note the insured or economic losses associated with catastrophes. But did you know that crime costs billions each year? The FBI reported nearly 7.2 million property crimes in the U.S. in 2018, with an estimated $16.4 billion in property crime losses, not including arson.
Although crime data can be spatially expressed just like flood, hurricane, hail and other perils, it is commonly an overlooked piece of the property risk puzzle, and therefore not often supported by underwriting guidelines. One of the factors contributing to the underuse of crime data is that it has generally lagged behind other hazard data in research and development. Now, however, leading data companies are creating models that account for the location where the crime actually occurred, allowing crime risk to be geographically represented.
Traditionally, crime data has not been detailed or accurate enough for underwriters to gain a comprehensive understanding of the true risk related to a property or portfolio. That’s because there is a lack of crimes reported at the geographic level versus the law enforcement agency level. Data from Location Inc. and Pitney Bowes, however, can be applied at the point of underwriting or portfolio management to help insurers assess the likelihood of violent crime, theft, vandalism and even behavior-based fire risk at the street level.
See also: Using High-Resolution Data for Flood Risk
Here are a few examples of how P&C insurers can apply crime risk data within a solution like SpatialKey for more informed underwriting and property risk assessment:
Use Case 1: Violent Crime & Property Crime
The below image shows a top tier college campus with a moderate crime score according to Location, Inc.’s SecurityGauge crime data. A moderate score is the national average for crime; however, the area around this college's location has an above-average crime rating.
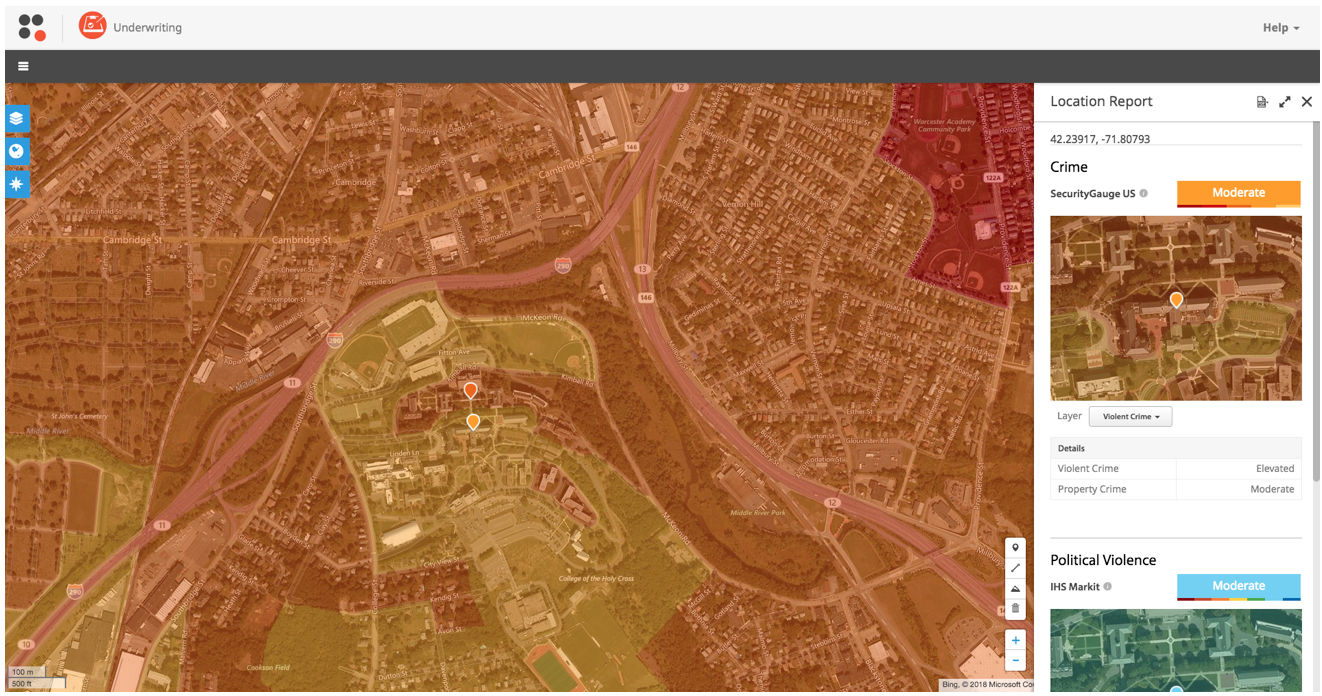 As you can see, there is a clear delineation between the school’s campus (near average risk relative to the nation, shown in yellow) and the surrounding city (in orange/red), which has an elevated crime score. So while the school itself is at or below the national average for crime risk, knowing that there is some high crime nearby could raise a flag to ensure proper coverages and adequate premiums are in place when underwriting this risk.
Use Case 2: Arson
When underwriting property risk outside the U.S. and Canada, for example in the U.K., Pitney Bowes crime data, for England, Wales, Scotland, and Northern Ireland, can be used within SpatialKey to understand factors driving overall risk, as shown below.
As you can see, there is a clear delineation between the school’s campus (near average risk relative to the nation, shown in yellow) and the surrounding city (in orange/red), which has an elevated crime score. So while the school itself is at or below the national average for crime risk, knowing that there is some high crime nearby could raise a flag to ensure proper coverages and adequate premiums are in place when underwriting this risk.
Use Case 2: Arson
When underwriting property risk outside the U.S. and Canada, for example in the U.K., Pitney Bowes crime data, for England, Wales, Scotland, and Northern Ireland, can be used within SpatialKey to understand factors driving overall risk, as shown below.
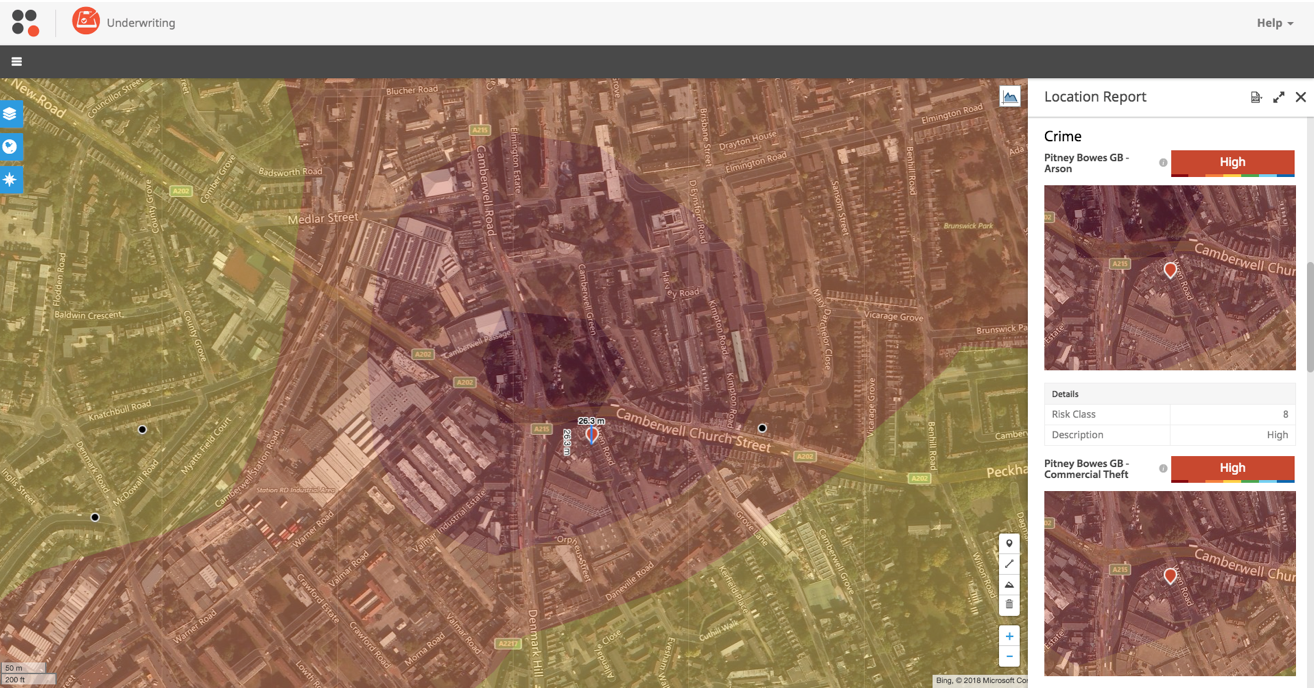 The location has a very high score (borderline extreme, in fact) for arson. When looking at this map, you can see that there is a bus depot across the street from the location in question. This information should factor into your risk assessment due to the flammable nature of the bus depot.
These use cases demonstrate how using expert crime risk data wcan help insurers:
The location has a very high score (borderline extreme, in fact) for arson. When looking at this map, you can see that there is a bus depot across the street from the location in question. This information should factor into your risk assessment due to the flammable nature of the bus depot.
These use cases demonstrate how using expert crime risk data wcan help insurers:
As you can see, there is a clear delineation between the school’s campus (near average risk relative to the nation, shown in yellow) and the surrounding city (in orange/red), which has an elevated crime score. So while the school itself is at or below the national average for crime risk, knowing that there is some high crime nearby could raise a flag to ensure proper coverages and adequate premiums are in place when underwriting this risk.
Use Case 2: Arson
When underwriting property risk outside the U.S. and Canada, for example in the U.K., Pitney Bowes crime data, for England, Wales, Scotland, and Northern Ireland, can be used within SpatialKey to understand factors driving overall risk, as shown below.
The location has a very high score (borderline extreme, in fact) for arson. When looking at this map, you can see that there is a bus depot across the street from the location in question. This information should factor into your risk assessment due to the flammable nature of the bus depot.
These use cases demonstrate how using expert crime risk data wcan help insurers:
- Gain a more comprehensive view and reduce adverse selection by determining the overall crime rate for an area at the street level.
- Adequately or more accurately price for the associated risk — For example, setting a higher theft deductible if the crime data shows increased crime in the area, or lower premium if the property has security measures on-premise such as cameras, lobby security, etc.
- Determine which coverages to limit or even exclude based on the characteristics of a particular neighborhood/community (e.g. for an apartment complex, review the crime data to determine the level of property and violent crime in the area and limit/exclude coverages accordingly).
- Evaluate concentrations of exposure in particular for a schedule of risks, as crime codes can vary greatly within the boundaries of a single city.