The 2017 Atlantic hurricane season was remarkable, including five landfalls of Category 5 storms in the Caribbean Basin and three Category 4 strikes on the U.S. coastline. The 2017 landfalls cost hundreds of lives and record-breaking economic losses, exceeding $250 billion. These losses are sober reminders of hurricane vulnerability and the importance of hurricane prediction for public safety and the management of insurance and other economic risks.
Hurricane forecasts have continued to improve in recent years, but they are not yet as good as they could be. Continued advances in weather and climate computer models used to make forecasts and improved observations from satellites and aircraft are driving these improvements. Also essential to progress are advances in understanding of weather and climate dynamics.
Short-term track and wind intensity forecasts
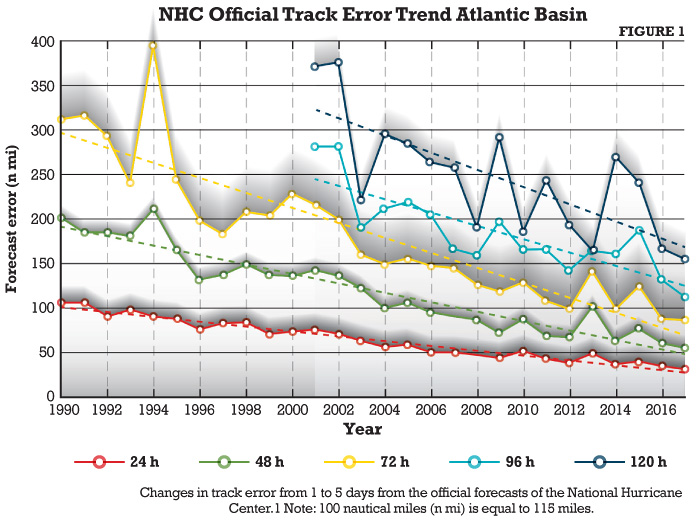
The National Hurricane Center (NHC) provides five-day forecasts of hurricane tracks and wind intensity that guide emergency management. Technological improvements from higher resolution weather forecast models and improved satellite observations are helping improve hurricane forecasts. The figure below shows the improvement over several decades in the NHC’s forecasted location of storms, referred to as “track error.” See figure 1 below.
An average track error at 48 hours of about 50 nautical miles is impressive in a meteorological context. However, a track uncertainty of just 50 nautical miles for Hurricane Irma’s predicted Florida landfall in 2017 meant the difference between a costly Miami landfall or a relatively benign Everglades landfall. As seen in the figure above, we are approaching a track forecast accuracy limit for one to two days, arising from the inherent unpredictability of weather. Over the past decade, the greatest improvements have been in the three- to five-day track forecasts.
A recent analysis conducted by Climate Forecast Applications Network (CFAN) compared track errors from different global and regional weather forecast models, all of which are considered by the NHC in preparing its forecast. The European model, operated by the European Center for Medium Range Weather Forecasting (ECMWF) and supported by 22 European countries, consistently outperformed the U.S. models maintained by the National Oceanic and Atmospheric Administration (NOAA) for track forecasts beyond two days. At five days lead time, the ECMWF model had an average track error for the 2017 season of 120 nautical miles, compared with 148 nm for the official NHC forecasts.
Innovators in the private sector apply proprietary algorithms to improve upon the NOAA and ECMWF model forecasts. At CFAN, ECMWF forecasts are corrected for model biases based on historical track errors. For 2017, CFAN’s bias-corrected storm tracks resulted in five-day average track error of 114 nautical miles – 26% lower than the average track error for the official NHC forecast.
Forecasts beyond five days (120 hours) are becoming increasingly important to the insurance community, especially with the development of insurance-linked securities and catastrophe bonds. The superior global weather forecasts provided by the European model (ECMWF) produced Atlantic hurricane tracks for 2017 with an average track error of 200 nautical miles out to eight days in advance. The proprietary track calibrations and synthetic tracks produced by CFAN from the European model maintain an average track error of 200 nautical miles even beyond 10 days, for the longest-lived storms.
Forecasting of storm wind intensity (as measured by maximum sustained wind speed) is also of key importance. The NHC’s intensity forecasts are slowly improving – the NHC’s intensity forecast errors at time horizons of two to five days average from 10 to 20 knots (10 knots = 11.5 mph) over the past several years. The greatest challenge in short-term hurricane forecasting remains the prediction of rapid intensification, as occurred with Hurricane Harvey in August 2017, immediately before landfall. The NHC has invested considerable resources in the development of high-resolution regional models to improve prediction of hurricane intensity. The prediction of rapid intensification remains elusive, although there is considerable research underway on this topic.
Seasonal and longer-term forecasts
Advances have been made in forecasting the probability of track locations on weekly timescales out to a month in advance. Monthly forecasts based on global weather forecast models are provided by several private sector weather forecast providers. Beyond the timescale of about a month, however, global models show little skill in predicting hurricanes. Hence, most seasonal forecasting efforts, particularly beyond timescales of six months, focus on data-driven statistical methods that examine longer-term trends in the global atmosphere.
Sea surface temperatures in the Atlantic and the tropical Pacific are key predictors for seasonal forecasts of Atlantic hurricane activity. El Niño (warmer tropical Pacific sea surface temperatures) and La Niña (cooler tropical Pacific sea surface temperatures) patterns have a strong influence, with La Niña being associated with higher levels of Atlantic hurricane activity.
Atmospheric circulation patterns also have some long-term “memory” that is useful for seasonal forecasts. CFAN’s research has identified additional predictors of seasonal Atlantic hurricane activity through examination of global and regional interactions among circulations in the ocean and in the lower and upper atmosphere. The predictors are identified through data mining, interpreted in the context of climate dynamics analysis, and then subjected to statistical tests in historical forecasts.
See also: Hurricane Harvey’s Lesson for Insurtechs
While forecasts issued around June 1 for the coming season generally have skill that is better than climatology, different outcomes are suggested by late May/early June forecasts for the 2018 Atlantic hurricane season. Predictions range from low activity (CFAN and Tropical Storm Risk ) to average activity (Colorado State University ) to near or above normal activity (NOAA Climate Prediction Center ). While many of the late May/early June 2017 forecasts predicted an above-normal season, none of the publicly reported forecasts predicted the extreme activity that was observed during the 2017 season.
At the longer forecast horizons, forecast skill is increasingly diminished. The greatest challenge in making seasonal forecasts in April and earlier is the springtime "predictability barrier" for El Niño/La Niña, whereby random spring weather events in the tropical Pacific Ocean during spring can determine its longer seasonal evolution. Seasonal forecasts from the latest version of the European model show substantially improved forecast skill of El Niño and La Niña across the spring predictability barrier, which improves the prospects for seasonal hurricane forecasts issued in late March/early April. La Niña generally heralds an active hurricane season, whereas El Niño is generally associated with a weak hurricane season. However, the occurrence of El Niño or La Niña accounts for only about half of year-to-year variation in Atlantic hurricane activity. In particular, the extremely active years such as 2017, 2004 and 2005 were not characterized by much of a signal from La Niña.
The greatest challenge for seasonal predictions of hurricane activity is to forecast the possibility of an extremely active hurricane season such as observed during 2017, 2005, 2004 and 1995. CFAN’s seasonal forecast models capture the extremes in 1995 and 2017 but not 2004 and 2005. Improved understanding of the causes of the extreme activity during 2004 and 2005 is an active area of research.
The most important target of seasonal forecasts is the number of landfalling hurricanes and their likely locations. The number of U.S. landfalling hurricanes in one year has varied from zero to six since 1920. The number of landfalling hurricanes is only moderately correlated with overall seasonal activity. It is notable that the period of overall elevated hurricane activity from 1995 to 2014 overlapped with a historic 2006-2014 drought of major hurricane and Florida landfalls.
Several seasonal forecasters provide a prediction of landfalls. These forecasts may specify the number of U.S. and Caribbean landfalls, the probability of a U.S. landfall (tropical storm, hurricane, major hurricane). Few forecast providers attempt to predict location of the landfalls. New research conducted by CFAN scientists has uncovered strong relationships between U.S. landfall totals and spring atmospheric circulation over the Arctic, which tends to precede summer dynamic conditions in the western North Atlantic and the Gulf of Mexico.
Certain insurance contracts with hurricane exposure typically take effect Jan. 1 of each year, and for this reason there has been a desire for Atlantic hurricane forecasts to be issued in December for the following season. Such contracts often are written for a period of a year or even longer time horizons. Because of the apparent lack of hurricane predictability on this time scale, in December Colorado State University provides a qualitative forecast discussion, rather than a forecast. CFAN research has identified some sources of hurricane predictability on timescales from 12 to 48 months. Research is underway to exploit this predictability into skillful annual and inter-annual predictions of Atlantic hurricane activity.
Five- to 10-year outlooks
Some atmospheric modelers provide a five-year outlook of annual hurricane activity, focused on landfall frequency. A key element of such for such outlooks is the state of the Atlantic Multidecadal Oscillation (AMO). The AMO is an ocean circulation pattern and related Atlantic sea surface temperature that changes in 25- to 40-year periods with increased or suppressed hurricane activity.
The year 1995 marked the transition to the warm phase of the AMO, which has been an active period for Atlantic hurricanes. In the warm phase of the AMO, sea surface temperatures in the tropical Atlantic are anomalously warm compared with the rest of the global tropics. These conditions produce weaker vertical wind shear and a stronger West African monsoon system that are conducive to increased hurricane activity in the North Atlantic.
There has been a great deal of uncertainty about the status of the AMO, complicated by the overall global warming trend. According to the AMO index produced by NOAA, the current positive (warm) AMO phase has not yet ended. In contrast, an alternative AMO definition, the standardized Klotzbach and Gray AMO Index, indicates the AMO has generally been in a negative (cooler) phase since 2014 – and May 2018 had the lowest value since 2015.
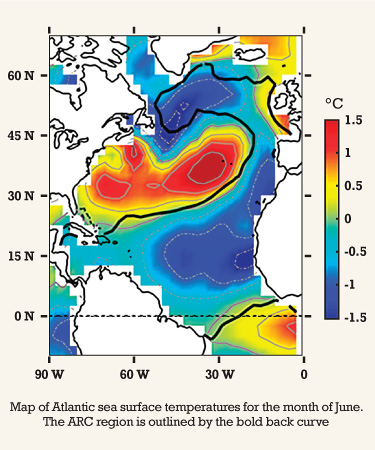
An intriguing development is underway in the Atlantic in 2018. The figure below shows sea surface temperature anomalies in the Atlantic for May. You see an arc of cold blue temperature anomalies extending from the equatorial Atlantic, up the coast of Africa and then in an east-west band just south of Greenland and Iceland. This pattern is referred to as the Atlantic ARC pattern. See figure 2 below.
A time series of sea surface temperature anomalies in the ARC region since 1880, depicted below, shows that temperature changes occur in sharp shifts occurring in 1902, 1926, 1971 and 1995. On the bottom graph, the ARC temperatures show a precipitous drop over the past few months. Is this just a cool anomaly, similar to 2002? Or does this portend a shift to cool phase of the AMO? See figure 3 below.
[caption id="attachment_32791" align="alignnone" width="375"] Figure 3. Top: ARC temperatures from 1880-2017. The black lines reflect the cold and warm regimes of the Atlantic Multidecadal Oscillation. Bottom: ARC temperatures from 1982 through June 2017.[/caption]
Based on past shifts, a forthcoming shift to the cool phase of the AMO is expected to have profound impacts:
diminished Atlantic hurricane activity
increased U.S. rainfall
decreased rainfall over India and the Sahel region of Africa
shift in north Atlantic fish stocks
acceleration of sea level rise on northeast U.S. coast.
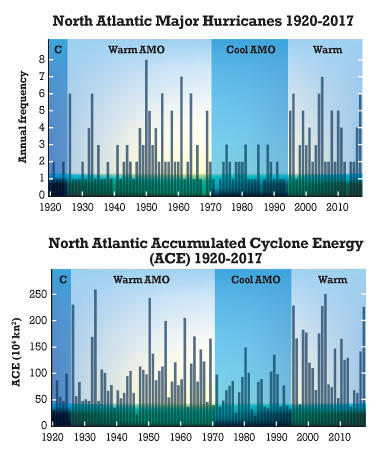
The figures below depict how the AMO has a substantial impact on Atlantic hurricanes. The top figure shows the time series of the number of major hurricanes since 1920. The warm phases of the AMO are shaded in yellow. There are substantially higher numbers of major hurricanes during the periods shaded in yellow. A similar effect of the AMO is seen on the Accumulated Cyclone Energy (ACE). Seasonal ACE is a measure of the overall activity of a hurricane season that accounts for the number, strength and duration of all of tropical storms in the season. See figure 4 below.
These variations in Florida landfalls associated with changes in the AMO have had a substantial impact on development in Florida. The spate of hurricanes starting in 1926 killed the economic boom that started in 1920. Florida’s population and development accelerated in the 1970s, aided by a period of low hurricane activity. By contrast, the warm versus cool phase of the AMO has little impact on the frequency of U.S. landfalling hurricanes generally. However, the phase of the AMO has a substantial impact on Florida landfalls. During the previous cold phase, no season had more than one Florida landfall, while during the warm phase there have been multiple years with as many as three landfalls. A major hurricane striking Florida is more than twice as likely during the warm phase relative to the cool phase.
New developments in decadal scale prediction are combining global climate model simulations with statistical models. Such predictions have shown improved skill relative to climatological and persistence forecasts on the decadal time scale.
See also: Tornadoes: Can We Stop the Cycle? 2018 Atlantic hurricane season
The recent tropic Pacific Ocean La Niña event is now over; the tropical Pacific is trending to neutral with an El Niño watch underway. Sea surface temperatures in the subtropical Atlantic are currently the lowest that have been seen since 1982. For the 2018 Atlantic hurricane season, many forecasters who predicted a normal or active season previously are now lowering their forecasts, considering the trend toward El Niño and the cool temperatures observed in the tropical Atlantic.
Based on the overall expectations for low Atlantic hurricane activity in 2018, combined with forecasts of a U.S. landfall ranging from 50% to 100%, we can expect 2018 to be a year with smaller economic loss from landfalling hurricanes relative to the average.
Looking at longer time horizons, there is a potential game-changer in play – a possible shift to the cold phase of the Atlantic Multidecadal Oscillation that would herald multiple decades of suppressed Atlantic hurricane activity that would have a substantial impact on reduced landfalls, particularly in Florida.
Get Involved
Our authors are what set Insurance Thought Leadership apart.


 An average track error at 48 hours of about 50 nautical miles is impressive in a meteorological context. However, a track uncertainty of just 50 nautical miles for Hurricane Irma’s predicted Florida landfall in 2017 meant the difference between a costly Miami landfall or a relatively benign Everglades landfall. As seen in the figure above, we are approaching a track forecast accuracy limit for one to two days, arising from the inherent unpredictability of weather. Over the past decade, the greatest improvements have been in the three- to five-day track forecasts.
A recent analysis conducted by Climate Forecast Applications Network (CFAN) compared track errors from different global and regional weather forecast models, all of which are considered by the NHC in preparing its forecast. The European model, operated by the European Center for Medium Range Weather Forecasting (ECMWF) and supported by 22 European countries, consistently outperformed the U.S. models maintained by the National Oceanic and Atmospheric Administration (NOAA) for track forecasts beyond two days. At five days lead time, the ECMWF model had an average track error for the 2017 season of 120 nautical miles, compared with 148 nm for the official NHC forecasts.
Innovators in the private sector apply proprietary algorithms to improve upon the NOAA and ECMWF model forecasts. At CFAN, ECMWF forecasts are corrected for model biases based on historical track errors. For 2017, CFAN’s bias-corrected storm tracks resulted in five-day average track error of 114 nautical miles – 26% lower than the average track error for the official NHC forecast.
Forecasts beyond five days (120 hours) are becoming increasingly important to the insurance community, especially with the development of insurance-linked securities and catastrophe bonds. The superior global weather forecasts provided by the European model (ECMWF) produced Atlantic hurricane tracks for 2017 with an average track error of 200 nautical miles out to eight days in advance. The proprietary track calibrations and synthetic tracks produced by CFAN from the European model maintain an average track error of 200 nautical miles even beyond 10 days, for the longest-lived storms.
Forecasting of storm wind intensity (as measured by maximum sustained wind speed) is also of key importance. The NHC’s intensity forecasts are slowly improving – the NHC’s intensity forecast errors at time horizons of two to five days average from 10 to 20 knots (10 knots = 11.5 mph) over the past several years. The greatest challenge in short-term hurricane forecasting remains the prediction of rapid intensification, as occurred with Hurricane Harvey in August 2017, immediately before landfall. The NHC has invested considerable resources in the development of high-resolution regional models to improve prediction of hurricane intensity. The prediction of rapid intensification remains elusive, although there is considerable research underway on this topic.
Seasonal and longer-term forecasts
Advances have been made in forecasting the probability of track locations on weekly timescales out to a month in advance. Monthly forecasts based on global weather forecast models are provided by several private sector weather forecast providers. Beyond the timescale of about a month, however, global models show little skill in predicting hurricanes. Hence, most seasonal forecasting efforts, particularly beyond timescales of six months, focus on data-driven statistical methods that examine longer-term trends in the global atmosphere.
Sea surface temperatures in the Atlantic and the tropical Pacific are key predictors for seasonal forecasts of Atlantic hurricane activity. El Niño (warmer tropical Pacific sea surface temperatures) and La Niña (cooler tropical Pacific sea surface temperatures) patterns have a strong influence, with La Niña being associated with higher levels of Atlantic hurricane activity.
Atmospheric circulation patterns also have some long-term “memory” that is useful for seasonal forecasts. CFAN’s research has identified additional predictors of seasonal Atlantic hurricane activity through examination of global and regional interactions among circulations in the ocean and in the lower and upper atmosphere. The predictors are identified through data mining, interpreted in the context of climate dynamics analysis, and then subjected to statistical tests in historical forecasts.
See also: Hurricane Harvey’s Lesson for Insurtechs
While forecasts issued around June 1 for the coming season generally have skill that is better than climatology, different outcomes are suggested by late May/early June forecasts for the 2018 Atlantic hurricane season. Predictions range from low activity (CFAN and Tropical Storm Risk ) to average activity (Colorado State University ) to near or above normal activity (NOAA Climate Prediction Center ). While many of the late May/early June 2017 forecasts predicted an above-normal season, none of the publicly reported forecasts predicted the extreme activity that was observed during the 2017 season.
At the longer forecast horizons, forecast skill is increasingly diminished. The greatest challenge in making seasonal forecasts in April and earlier is the springtime "predictability barrier" for El Niño/La Niña, whereby random spring weather events in the tropical Pacific Ocean during spring can determine its longer seasonal evolution. Seasonal forecasts from the latest version of the European model show substantially improved forecast skill of El Niño and La Niña across the spring predictability barrier, which improves the prospects for seasonal hurricane forecasts issued in late March/early April. La Niña generally heralds an active hurricane season, whereas El Niño is generally associated with a weak hurricane season. However, the occurrence of El Niño or La Niña accounts for only about half of year-to-year variation in Atlantic hurricane activity. In particular, the extremely active years such as 2017, 2004 and 2005 were not characterized by much of a signal from La Niña.
The greatest challenge for seasonal predictions of hurricane activity is to forecast the possibility of an extremely active hurricane season such as observed during 2017, 2005, 2004 and 1995. CFAN’s seasonal forecast models capture the extremes in 1995 and 2017 but not 2004 and 2005. Improved understanding of the causes of the extreme activity during 2004 and 2005 is an active area of research.
The most important target of seasonal forecasts is the number of landfalling hurricanes and their likely locations. The number of U.S. landfalling hurricanes in one year has varied from zero to six since 1920. The number of landfalling hurricanes is only moderately correlated with overall seasonal activity. It is notable that the period of overall elevated hurricane activity from 1995 to 2014 overlapped with a historic 2006-2014 drought of major hurricane and Florida landfalls.
Several seasonal forecasters provide a prediction of landfalls. These forecasts may specify the number of U.S. and Caribbean landfalls, the probability of a U.S. landfall (tropical storm, hurricane, major hurricane). Few forecast providers attempt to predict location of the landfalls. New research conducted by CFAN scientists has uncovered strong relationships between U.S. landfall totals and spring atmospheric circulation over the Arctic, which tends to precede summer dynamic conditions in the western North Atlantic and the Gulf of Mexico.
Certain insurance contracts with hurricane exposure typically take effect Jan. 1 of each year, and for this reason there has been a desire for Atlantic hurricane forecasts to be issued in December for the following season. Such contracts often are written for a period of a year or even longer time horizons. Because of the apparent lack of hurricane predictability on this time scale, in December Colorado State University provides a qualitative forecast discussion, rather than a forecast. CFAN research has identified some sources of hurricane predictability on timescales from 12 to 48 months. Research is underway to exploit this predictability into skillful annual and inter-annual predictions of Atlantic hurricane activity.
Five- to 10-year outlooks
Some atmospheric modelers provide a five-year outlook of annual hurricane activity, focused on landfall frequency. A key element of such for such outlooks is the state of the Atlantic Multidecadal Oscillation (AMO). The AMO is an ocean circulation pattern and related Atlantic sea surface temperature that changes in 25- to 40-year periods with increased or suppressed hurricane activity.
The year 1995 marked the transition to the warm phase of the AMO, which has been an active period for Atlantic hurricanes. In the warm phase of the AMO, sea surface temperatures in the tropical Atlantic are anomalously warm compared with the rest of the global tropics. These conditions produce weaker vertical wind shear and a stronger West African monsoon system that are conducive to increased hurricane activity in the North Atlantic.
There has been a great deal of uncertainty about the status of the AMO, complicated by the overall global warming trend. According to the AMO index produced by NOAA, the current positive (warm) AMO phase has not yet ended. In contrast, an alternative AMO definition, the standardized Klotzbach and Gray AMO Index, indicates the AMO has generally been in a negative (cooler) phase since 2014 – and May 2018 had the lowest value since 2015.
An average track error at 48 hours of about 50 nautical miles is impressive in a meteorological context. However, a track uncertainty of just 50 nautical miles for Hurricane Irma’s predicted Florida landfall in 2017 meant the difference between a costly Miami landfall or a relatively benign Everglades landfall. As seen in the figure above, we are approaching a track forecast accuracy limit for one to two days, arising from the inherent unpredictability of weather. Over the past decade, the greatest improvements have been in the three- to five-day track forecasts.
A recent analysis conducted by Climate Forecast Applications Network (CFAN) compared track errors from different global and regional weather forecast models, all of which are considered by the NHC in preparing its forecast. The European model, operated by the European Center for Medium Range Weather Forecasting (ECMWF) and supported by 22 European countries, consistently outperformed the U.S. models maintained by the National Oceanic and Atmospheric Administration (NOAA) for track forecasts beyond two days. At five days lead time, the ECMWF model had an average track error for the 2017 season of 120 nautical miles, compared with 148 nm for the official NHC forecasts.
Innovators in the private sector apply proprietary algorithms to improve upon the NOAA and ECMWF model forecasts. At CFAN, ECMWF forecasts are corrected for model biases based on historical track errors. For 2017, CFAN’s bias-corrected storm tracks resulted in five-day average track error of 114 nautical miles – 26% lower than the average track error for the official NHC forecast.
Forecasts beyond five days (120 hours) are becoming increasingly important to the insurance community, especially with the development of insurance-linked securities and catastrophe bonds. The superior global weather forecasts provided by the European model (ECMWF) produced Atlantic hurricane tracks for 2017 with an average track error of 200 nautical miles out to eight days in advance. The proprietary track calibrations and synthetic tracks produced by CFAN from the European model maintain an average track error of 200 nautical miles even beyond 10 days, for the longest-lived storms.
Forecasting of storm wind intensity (as measured by maximum sustained wind speed) is also of key importance. The NHC’s intensity forecasts are slowly improving – the NHC’s intensity forecast errors at time horizons of two to five days average from 10 to 20 knots (10 knots = 11.5 mph) over the past several years. The greatest challenge in short-term hurricane forecasting remains the prediction of rapid intensification, as occurred with Hurricane Harvey in August 2017, immediately before landfall. The NHC has invested considerable resources in the development of high-resolution regional models to improve prediction of hurricane intensity. The prediction of rapid intensification remains elusive, although there is considerable research underway on this topic.
Seasonal and longer-term forecasts
Advances have been made in forecasting the probability of track locations on weekly timescales out to a month in advance. Monthly forecasts based on global weather forecast models are provided by several private sector weather forecast providers. Beyond the timescale of about a month, however, global models show little skill in predicting hurricanes. Hence, most seasonal forecasting efforts, particularly beyond timescales of six months, focus on data-driven statistical methods that examine longer-term trends in the global atmosphere.
Sea surface temperatures in the Atlantic and the tropical Pacific are key predictors for seasonal forecasts of Atlantic hurricane activity. El Niño (warmer tropical Pacific sea surface temperatures) and La Niña (cooler tropical Pacific sea surface temperatures) patterns have a strong influence, with La Niña being associated with higher levels of Atlantic hurricane activity.
Atmospheric circulation patterns also have some long-term “memory” that is useful for seasonal forecasts. CFAN’s research has identified additional predictors of seasonal Atlantic hurricane activity through examination of global and regional interactions among circulations in the ocean and in the lower and upper atmosphere. The predictors are identified through data mining, interpreted in the context of climate dynamics analysis, and then subjected to statistical tests in historical forecasts.
See also: Hurricane Harvey’s Lesson for Insurtechs
While forecasts issued around June 1 for the coming season generally have skill that is better than climatology, different outcomes are suggested by late May/early June forecasts for the 2018 Atlantic hurricane season. Predictions range from low activity (CFAN and Tropical Storm Risk ) to average activity (Colorado State University ) to near or above normal activity (NOAA Climate Prediction Center ). While many of the late May/early June 2017 forecasts predicted an above-normal season, none of the publicly reported forecasts predicted the extreme activity that was observed during the 2017 season.
At the longer forecast horizons, forecast skill is increasingly diminished. The greatest challenge in making seasonal forecasts in April and earlier is the springtime "predictability barrier" for El Niño/La Niña, whereby random spring weather events in the tropical Pacific Ocean during spring can determine its longer seasonal evolution. Seasonal forecasts from the latest version of the European model show substantially improved forecast skill of El Niño and La Niña across the spring predictability barrier, which improves the prospects for seasonal hurricane forecasts issued in late March/early April. La Niña generally heralds an active hurricane season, whereas El Niño is generally associated with a weak hurricane season. However, the occurrence of El Niño or La Niña accounts for only about half of year-to-year variation in Atlantic hurricane activity. In particular, the extremely active years such as 2017, 2004 and 2005 were not characterized by much of a signal from La Niña.
The greatest challenge for seasonal predictions of hurricane activity is to forecast the possibility of an extremely active hurricane season such as observed during 2017, 2005, 2004 and 1995. CFAN’s seasonal forecast models capture the extremes in 1995 and 2017 but not 2004 and 2005. Improved understanding of the causes of the extreme activity during 2004 and 2005 is an active area of research.
The most important target of seasonal forecasts is the number of landfalling hurricanes and their likely locations. The number of U.S. landfalling hurricanes in one year has varied from zero to six since 1920. The number of landfalling hurricanes is only moderately correlated with overall seasonal activity. It is notable that the period of overall elevated hurricane activity from 1995 to 2014 overlapped with a historic 2006-2014 drought of major hurricane and Florida landfalls.
Several seasonal forecasters provide a prediction of landfalls. These forecasts may specify the number of U.S. and Caribbean landfalls, the probability of a U.S. landfall (tropical storm, hurricane, major hurricane). Few forecast providers attempt to predict location of the landfalls. New research conducted by CFAN scientists has uncovered strong relationships between U.S. landfall totals and spring atmospheric circulation over the Arctic, which tends to precede summer dynamic conditions in the western North Atlantic and the Gulf of Mexico.
Certain insurance contracts with hurricane exposure typically take effect Jan. 1 of each year, and for this reason there has been a desire for Atlantic hurricane forecasts to be issued in December for the following season. Such contracts often are written for a period of a year or even longer time horizons. Because of the apparent lack of hurricane predictability on this time scale, in December Colorado State University provides a qualitative forecast discussion, rather than a forecast. CFAN research has identified some sources of hurricane predictability on timescales from 12 to 48 months. Research is underway to exploit this predictability into skillful annual and inter-annual predictions of Atlantic hurricane activity.
Five- to 10-year outlooks
Some atmospheric modelers provide a five-year outlook of annual hurricane activity, focused on landfall frequency. A key element of such for such outlooks is the state of the Atlantic Multidecadal Oscillation (AMO). The AMO is an ocean circulation pattern and related Atlantic sea surface temperature that changes in 25- to 40-year periods with increased or suppressed hurricane activity.
The year 1995 marked the transition to the warm phase of the AMO, which has been an active period for Atlantic hurricanes. In the warm phase of the AMO, sea surface temperatures in the tropical Atlantic are anomalously warm compared with the rest of the global tropics. These conditions produce weaker vertical wind shear and a stronger West African monsoon system that are conducive to increased hurricane activity in the North Atlantic.
There has been a great deal of uncertainty about the status of the AMO, complicated by the overall global warming trend. According to the AMO index produced by NOAA, the current positive (warm) AMO phase has not yet ended. In contrast, an alternative AMO definition, the standardized Klotzbach and Gray AMO Index, indicates the AMO has generally been in a negative (cooler) phase since 2014 – and May 2018 had the lowest value since 2015.
 A time series of sea surface temperature anomalies in the ARC region since 1880, depicted below, shows that temperature changes occur in sharp shifts occurring in 1902, 1926, 1971 and 1995. On the bottom graph, the ARC temperatures show a precipitous drop over the past few months. Is this just a cool anomaly, similar to 2002? Or does this portend a shift to cool phase of the AMO? See figure 3 below.
[caption id="attachment_32791" align="alignnone" width="375"]
A time series of sea surface temperature anomalies in the ARC region since 1880, depicted below, shows that temperature changes occur in sharp shifts occurring in 1902, 1926, 1971 and 1995. On the bottom graph, the ARC temperatures show a precipitous drop over the past few months. Is this just a cool anomaly, similar to 2002? Or does this portend a shift to cool phase of the AMO? See figure 3 below.
[caption id="attachment_32791" align="alignnone" width="375"] Figure 3. Top: ARC temperatures from 1880-2017. The black lines reflect the cold and warm regimes of the Atlantic Multidecadal Oscillation. Bottom: ARC temperatures from 1982 through June 2017.[/caption]
Based on past shifts, a forthcoming shift to the cool phase of the AMO is expected to have profound impacts:
Figure 3. Top: ARC temperatures from 1880-2017. The black lines reflect the cold and warm regimes of the Atlantic Multidecadal Oscillation. Bottom: ARC temperatures from 1982 through June 2017.[/caption]
Based on past shifts, a forthcoming shift to the cool phase of the AMO is expected to have profound impacts:
 These variations in Florida landfalls associated with changes in the AMO have had a substantial impact on development in Florida. The spate of hurricanes starting in 1926 killed the economic boom that started in 1920. Florida’s population and development accelerated in the 1970s, aided by a period of low hurricane activity. By contrast, the warm versus cool phase of the AMO has little impact on the frequency of U.S. landfalling hurricanes generally. However, the phase of the AMO has a substantial impact on Florida landfalls. During the previous cold phase, no season had more than one Florida landfall, while during the warm phase there have been multiple years with as many as three landfalls. A major hurricane striking Florida is more than twice as likely during the warm phase relative to the cool phase.
New developments in decadal scale prediction are combining global climate model simulations with statistical models. Such predictions have shown improved skill relative to climatological and persistence forecasts on the decadal time scale.
See also: Tornadoes: Can We Stop the Cycle?
2018 Atlantic hurricane season
The recent tropic Pacific Ocean La Niña event is now over; the tropical Pacific is trending to neutral with an El Niño watch underway. Sea surface temperatures in the subtropical Atlantic are currently the lowest that have been seen since 1982. For the 2018 Atlantic hurricane season, many forecasters who predicted a normal or active season previously are now lowering their forecasts, considering the trend toward El Niño and the cool temperatures observed in the tropical Atlantic.
Based on the overall expectations for low Atlantic hurricane activity in 2018, combined with forecasts of a U.S. landfall ranging from 50% to 100%, we can expect 2018 to be a year with smaller economic loss from landfalling hurricanes relative to the average.
Looking at longer time horizons, there is a potential game-changer in play – a possible shift to the cold phase of the Atlantic Multidecadal Oscillation that would herald multiple decades of suppressed Atlantic hurricane activity that would have a substantial impact on reduced landfalls, particularly in Florida.
These variations in Florida landfalls associated with changes in the AMO have had a substantial impact on development in Florida. The spate of hurricanes starting in 1926 killed the economic boom that started in 1920. Florida’s population and development accelerated in the 1970s, aided by a period of low hurricane activity. By contrast, the warm versus cool phase of the AMO has little impact on the frequency of U.S. landfalling hurricanes generally. However, the phase of the AMO has a substantial impact on Florida landfalls. During the previous cold phase, no season had more than one Florida landfall, while during the warm phase there have been multiple years with as many as three landfalls. A major hurricane striking Florida is more than twice as likely during the warm phase relative to the cool phase.
New developments in decadal scale prediction are combining global climate model simulations with statistical models. Such predictions have shown improved skill relative to climatological and persistence forecasts on the decadal time scale.
See also: Tornadoes: Can We Stop the Cycle?
2018 Atlantic hurricane season
The recent tropic Pacific Ocean La Niña event is now over; the tropical Pacific is trending to neutral with an El Niño watch underway. Sea surface temperatures in the subtropical Atlantic are currently the lowest that have been seen since 1982. For the 2018 Atlantic hurricane season, many forecasters who predicted a normal or active season previously are now lowering their forecasts, considering the trend toward El Niño and the cool temperatures observed in the tropical Atlantic.
Based on the overall expectations for low Atlantic hurricane activity in 2018, combined with forecasts of a U.S. landfall ranging from 50% to 100%, we can expect 2018 to be a year with smaller economic loss from landfalling hurricanes relative to the average.
Looking at longer time horizons, there is a potential game-changer in play – a possible shift to the cold phase of the Atlantic Multidecadal Oscillation that would herald multiple decades of suppressed Atlantic hurricane activity that would have a substantial impact on reduced landfalls, particularly in Florida.