

In the comedy by William Shakespeare, “The Taming of the Shrew,” the main plot depicts the courtship of Petruchio and Katherina, the headstrong, uncooperative shrew. Initially, Katherina is an unwilling participant in the relationship, but Petruchio breaks down her resistance with various psychological torments, which make up the “taming” — until she finally becomes agreeable.
An analogous challenge exists when using predictive analytics with healthcare data. Healthcare data can often seem quite stubborn, like Katherina. One of the main features of healthcare data that needs to be “tamed” is the “skew.” In this article, we describe two types of skewness: the statistical skew, which affects data analysis, and the operational skew, which affects operational processes. (Neither is a comedy.)
The Statistical Skew
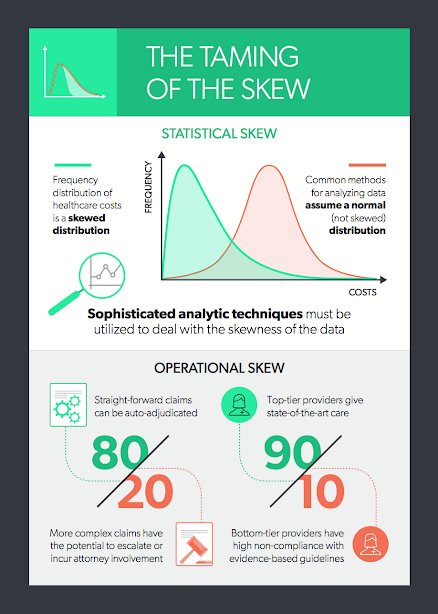
Because the distribution of healthcare costs is bounded on the lower end — that is, the cost of healthcare services is never less than zero — but ranges widely on the upper end, sometimes into the millions of dollars, the frequency distribution of costs is skewed. More specifically, in the following plot of frequency by cost, the distribution of healthcare costs is right-skewed because the long tail is on the right (and the coefficient of skewness is positive):
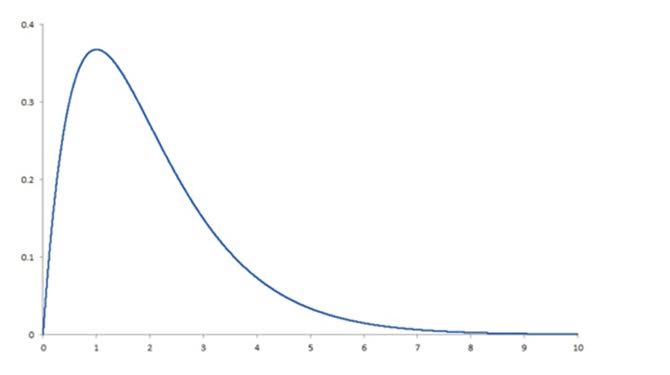 This skewness is present whether we are looking at total claim expense in the workers’ compensation sector or annual expenses in the group health sector. Why is this a problem? Simply because the most common methods for analyzing data depend on the ability to assume that there is a normal distribution, and a right-skewed distribution is clearly not normal. To produce reliable predictions and generalizable results from analyses of healthcare costs, the data need to be “tamed” (i.e., various sophisticated analytic techniques must be used to deal with the right-skewness of the data). Among these techniques are logarithmic transformation of the dependent variable, random forest regression, machine learning and topical analysis.
It’s essential to keep this in mind in any analytic effort with healthcare data, especially in workers’ compensation. To get the required level of accuracy, we need to think “non-normal” and get comfortable with the “skewed” behavior of the data.
Operational Skew
There is an equally pervasive operational skew in workers’ compensation that calls out for a radical change in business models. The operational skew is exemplified by:
This skewness is present whether we are looking at total claim expense in the workers’ compensation sector or annual expenses in the group health sector. Why is this a problem? Simply because the most common methods for analyzing data depend on the ability to assume that there is a normal distribution, and a right-skewed distribution is clearly not normal. To produce reliable predictions and generalizable results from analyses of healthcare costs, the data need to be “tamed” (i.e., various sophisticated analytic techniques must be used to deal with the right-skewness of the data). Among these techniques are logarithmic transformation of the dependent variable, random forest regression, machine learning and topical analysis.
It’s essential to keep this in mind in any analytic effort with healthcare data, especially in workers’ compensation. To get the required level of accuracy, we need to think “non-normal” and get comfortable with the “skewed” behavior of the data.
Operational Skew
There is an equally pervasive operational skew in workers’ compensation that calls out for a radical change in business models. The operational skew is exemplified by:
 Read Dr. Gardner’s first two articles in this series:
Five Best Practices to Ensure the Injured Worker Comes First
Cycle Time Is King
As first published in Claims Journal.
Read Dr. Gardner’s first two articles in this series:
Five Best Practices to Ensure the Injured Worker Comes First
Cycle Time Is King
As first published in Claims Journal.
This skewness is present whether we are looking at total claim expense in the workers’ compensation sector or annual expenses in the group health sector. Why is this a problem? Simply because the most common methods for analyzing data depend on the ability to assume that there is a normal distribution, and a right-skewed distribution is clearly not normal. To produce reliable predictions and generalizable results from analyses of healthcare costs, the data need to be “tamed” (i.e., various sophisticated analytic techniques must be used to deal with the right-skewness of the data). Among these techniques are logarithmic transformation of the dependent variable, random forest regression, machine learning and topical analysis.
It’s essential to keep this in mind in any analytic effort with healthcare data, especially in workers’ compensation. To get the required level of accuracy, we need to think “non-normal” and get comfortable with the “skewed” behavior of the data.
Operational Skew
There is an equally pervasive operational skew in workers’ compensation that calls out for a radical change in business models. The operational skew is exemplified by:
- The 80/20 split between simple, straightforward claims that can be auto-adjudicated and more complex claims that have the potential to escalate or incur attorney involvement (i.e., 80% of the costs come from 20% of the claims).
- The even more extreme 90/10 split between good providers delivering state-of-the-art care and the “bad apples” whose care is less effective, less often compliant with evidence-based guidelines or more expensive for a similar or worse result. (i.e., 90% of the costs come from 10% of the providers).
- Claims can be categorized as early as Day 1 into low vs. high risk with respect to potential for cost escalation or attorney involvement. This enables payers to apply the appropriate amount of oversight, intervention and cost containment resources based on the risk of the claim.
- Provider outcomes can be evaluated, summarized and scored, empowering network managers to fine-tune their networks and claims adjusters to recommend the best doctors to each injured worker.
Read Dr. Gardner’s first two articles in this series:
Five Best Practices to Ensure the Injured Worker Comes First
Cycle Time Is King
As first published in Claims Journal.