
This is the third in a series. The first two articles can be found here and here.
When catastrophes strike, you have no time. You’re under pressure to quickly understand the financial impact of an event and provide estimates to management. At the same time, you (and your team) are constantly tracking the event, processing hazard data, making sure exposure data is accurate, pulling reports and (let's hope) beginning outreach to insureds. The last item—customer outreach—may suffer, though, when the other to-dos consume your time and resources.
Speed and quality of response following catastrophes can be an asset to your organization—and a key reason why your customers choose you over your competitors—but only if you can make your event response operations run like clockwork. This entails moving away from the status quo and integrating elements of automation into your event response processes. Let's take a look at some of the challenges you may face and how to implement a more proactive approach for minimal cost and disruption.
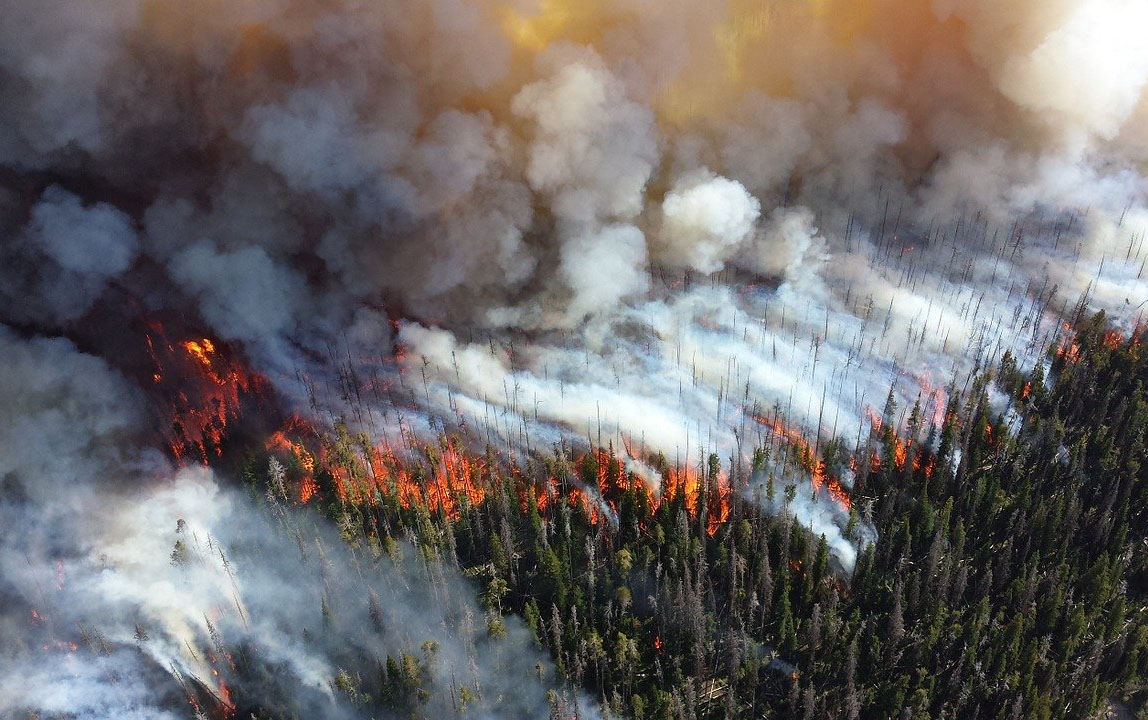
Hurricanes, in particular, illustrate the problem of quickly deriving insight from data. For example, does the following scenario sound familiar?
Imagine a hurricane strikes...
...and it’s affecting Texas, Florida or the Carolinas (probably not too hard to imagine, actually). Management is asking for the estimated financial impact of this event, and your stress levels are rising. It’s all hands on deck!
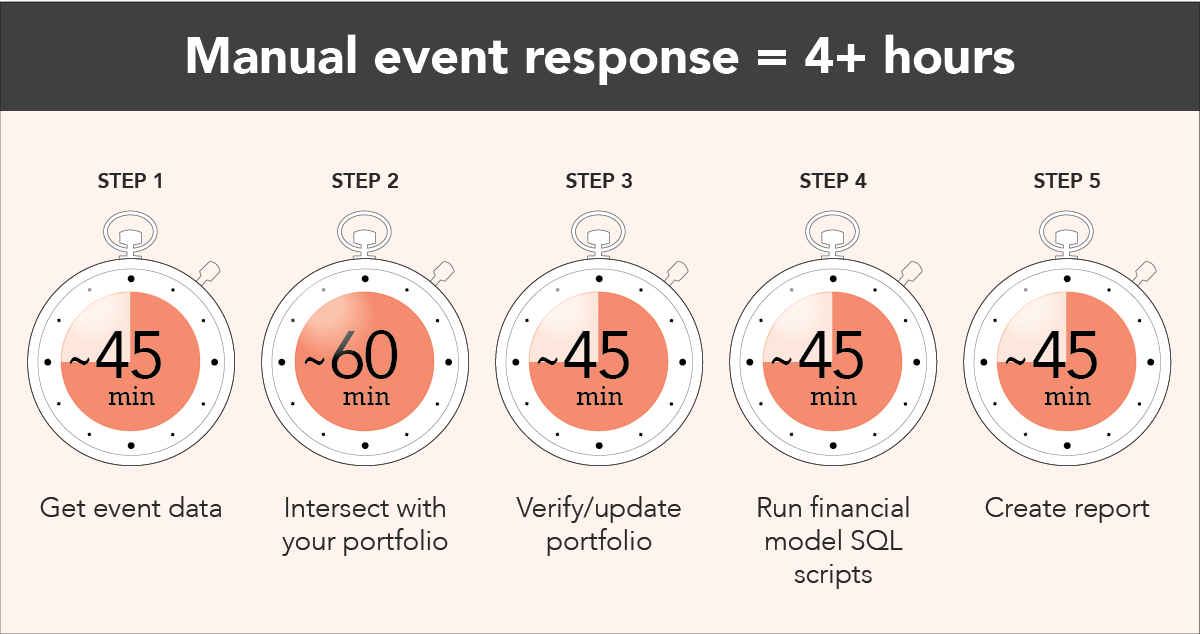 1) Get event data
You go to the NOAA website, pull down wind datasets from the latest update and work to get them into a usable format.
2) Intersect with your portfolio
Now, it’s time to intersect the footprint with your portfolio data, which may take another hour or so.
3) Update portfolio
After you get everything set up, you realize your portfolio is six months old, which may over- or underestimate your actual exposure. Do you pull an updated snapshot of your exposures? Probably not, because there isn’t enough time!
4) Run financial model SQL scripts
With a manual intersection process, you are likely unable to easily access the impact of policy terms and conditions, so you’ll need to run some financial model scripts to determine the actual exposure for this event.
5) Create and share reports
You finally get some financial numbers ready and format them into a nice report for management.
Then, you think about what you actually had on your to-do list for the day before the hurricane was in the picture...or, wait, maybe not...because just then you see that NOAA has published the next snapshot of the hurricane.
Rinse and repeat. It’s going to be a long night.
See also: How to Predict Atlantic Hurricanes
Let’s face it, if you can’t extract insight from data fast enough to mitigate damage or provide a timely course of action, your operational efficiency and downstream customer satisfaction go downhill fast. And just think, this was for a single data source. Realistically, you have to perform these same steps across multiple sources to gain a complete understanding of this event. (e.g. KatRisk, Impact Forecasting, JBA flood, NOAA probability surge).
What makes the process so inefficient?
1) Get event data
You go to the NOAA website, pull down wind datasets from the latest update and work to get them into a usable format.
2) Intersect with your portfolio
Now, it’s time to intersect the footprint with your portfolio data, which may take another hour or so.
3) Update portfolio
After you get everything set up, you realize your portfolio is six months old, which may over- or underestimate your actual exposure. Do you pull an updated snapshot of your exposures? Probably not, because there isn’t enough time!
4) Run financial model SQL scripts
With a manual intersection process, you are likely unable to easily access the impact of policy terms and conditions, so you’ll need to run some financial model scripts to determine the actual exposure for this event.
5) Create and share reports
You finally get some financial numbers ready and format them into a nice report for management.
Then, you think about what you actually had on your to-do list for the day before the hurricane was in the picture...or, wait, maybe not...because just then you see that NOAA has published the next snapshot of the hurricane.
Rinse and repeat. It’s going to be a long night.
See also: How to Predict Atlantic Hurricanes
Let’s face it, if you can’t extract insight from data fast enough to mitigate damage or provide a timely course of action, your operational efficiency and downstream customer satisfaction go downhill fast. And just think, this was for a single data source. Realistically, you have to perform these same steps across multiple sources to gain a complete understanding of this event. (e.g. KatRisk, Impact Forecasting, JBA flood, NOAA probability surge).
What makes the process so inefficient?
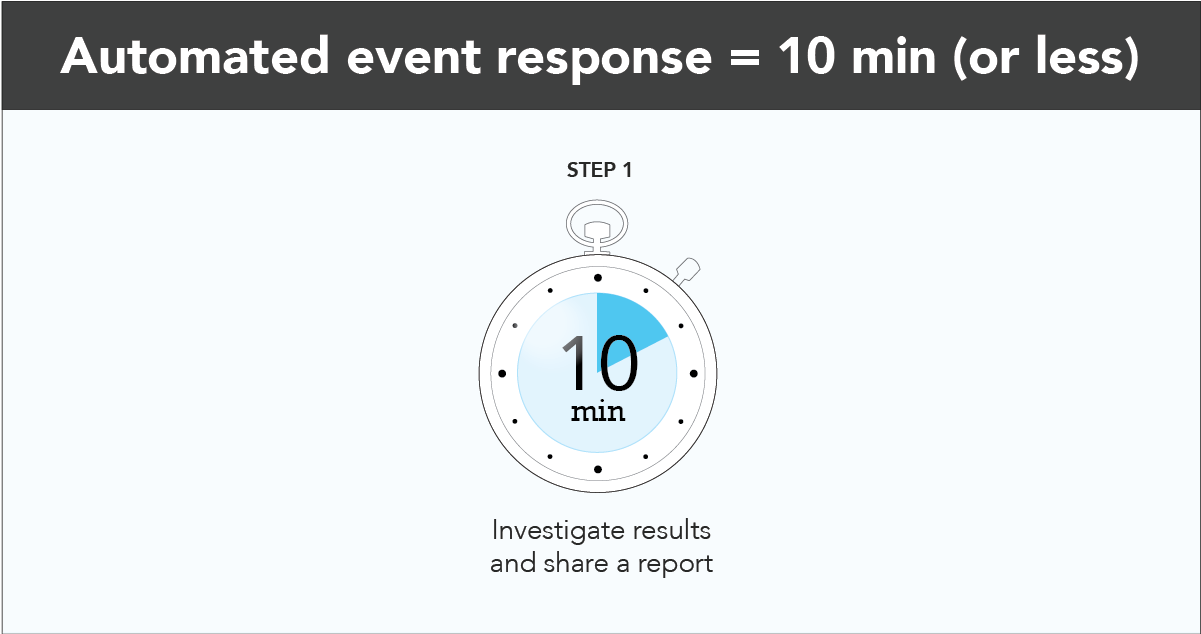 Within moments of NOAA publishing an update, you receive an email notifying you of the financial and insured impact. With the click of a button, you’re in a live dashboard, investigating the event, your affected exposures and more.
You still have to get those numbers to management, but this time you can breathe easy knowing that your numbers are not only accurate, but that the whole process took a fraction of the time. Now when NOAA (or any other public or private data provider) pushes the next update, you’ll be set with a highly scalable infrastructure that enriches your data, calculates financial impact and produces a report within minutes.
Why was this process much more efficient?
Within moments of NOAA publishing an update, you receive an email notifying you of the financial and insured impact. With the click of a button, you’re in a live dashboard, investigating the event, your affected exposures and more.
You still have to get those numbers to management, but this time you can breathe easy knowing that your numbers are not only accurate, but that the whole process took a fraction of the time. Now when NOAA (or any other public or private data provider) pushes the next update, you’ll be set with a highly scalable infrastructure that enriches your data, calculates financial impact and produces a report within minutes.
Why was this process much more efficient?
1) Get event data
You go to the NOAA website, pull down wind datasets from the latest update and work to get them into a usable format.
2) Intersect with your portfolio
Now, it’s time to intersect the footprint with your portfolio data, which may take another hour or so.
3) Update portfolio
After you get everything set up, you realize your portfolio is six months old, which may over- or underestimate your actual exposure. Do you pull an updated snapshot of your exposures? Probably not, because there isn’t enough time!
4) Run financial model SQL scripts
With a manual intersection process, you are likely unable to easily access the impact of policy terms and conditions, so you’ll need to run some financial model scripts to determine the actual exposure for this event.
5) Create and share reports
You finally get some financial numbers ready and format them into a nice report for management.
Then, you think about what you actually had on your to-do list for the day before the hurricane was in the picture...or, wait, maybe not...because just then you see that NOAA has published the next snapshot of the hurricane.
Rinse and repeat. It’s going to be a long night.
See also: How to Predict Atlantic Hurricanes
Let’s face it, if you can’t extract insight from data fast enough to mitigate damage or provide a timely course of action, your operational efficiency and downstream customer satisfaction go downhill fast. And just think, this was for a single data source. Realistically, you have to perform these same steps across multiple sources to gain a complete understanding of this event. (e.g. KatRisk, Impact Forecasting, JBA flood, NOAA probability surge).
What makes the process so inefficient?
- You had to source the data yourself and operationalize it (i.e., get it into a usable format)
- You had to navigate the complexity of the data, which can be exceptionally time-consuming (depending on the source, resolution and other variables)
- You realized your portfolio data was out of date (this is a big problem because how can you determine actual financial impact against outdated information?)
- You had to manually run a financial model after determining the exposures that could be affected by the event
- And, of course, you had to manually pull the information together into a report for stakeholders
Within moments of NOAA publishing an update, you receive an email notifying you of the financial and insured impact. With the click of a button, you’re in a live dashboard, investigating the event, your affected exposures and more.
You still have to get those numbers to management, but this time you can breathe easy knowing that your numbers are not only accurate, but that the whole process took a fraction of the time. Now when NOAA (or any other public or private data provider) pushes the next update, you’ll be set with a highly scalable infrastructure that enriches your data, calculates financial impact and produces a report within minutes.
Why was this process much more efficient?
- Because you invested a couple hours up front to integrate API technology, your exposure data was up to date
- You had access to pre-processed, ready-to-use hazard footprints as they became available
- The event was monitored 24/7 so you didn’t have to constantly track it and pull reports to understand what changed
- Custom filters and thresholds ensured you were never inundated with notifications and only received metrics that you care about
- You saved a bundle of time because a financial report was auto-generated for you to pass along to upper management
- You were able to quickly share reports across teams so claims could get a head start on their customer outreach