The domestic U.S. excess and surplus lines insurance market has experienced rapid growth in direct written premium (“DWP”) in recent years, and our preliminary survey of 2021 annual statement data for a selected cohort of carriers suggests this growth accelerated in 2021, putting the E&S market on pace to write over $60 billion of direct premium in 2021, an increase of nearly 30% over 2020.
Significant rate activity started toward the end of 2019, and the E&S cohort’s published underwriting results have since improved, with many writers reporting favorable results. Within its largest line of business, Other Liability – Occurrence, the E&S cohort’s booked direct and assumed (D&A) ultimate loss and loss adjustment expense (LAE) ratio for coverage year 2021 is 64%, up slightly from the coverage year 2020 ratio of 63%, but down approximately five to 10 percentage points from the ratios booked between coverage years 2017 and 2019.
However, deterioration in the E&S cohort’s underwriting results across coverage years 2019 and prior, in total, across all lines of business, has resulted in adverse reserve development in calendar year 2021. Though the magnitude of this deterioration is relatively small, it is the first such observation since 2004. Social inflation may account for some of this unexpected development.
All things considered; the results of our survey suggest the E&S market has experienced further hardening in 2021.
The following sections detail the results of our preliminary survey:
E&S Market Growth
As illustrated in Chart 1 below, the 2021 E&S market has likely experienced its largest annual increase in DWP since 2003:
Chart 1: E&S Market Change in DWP by Calendar Year
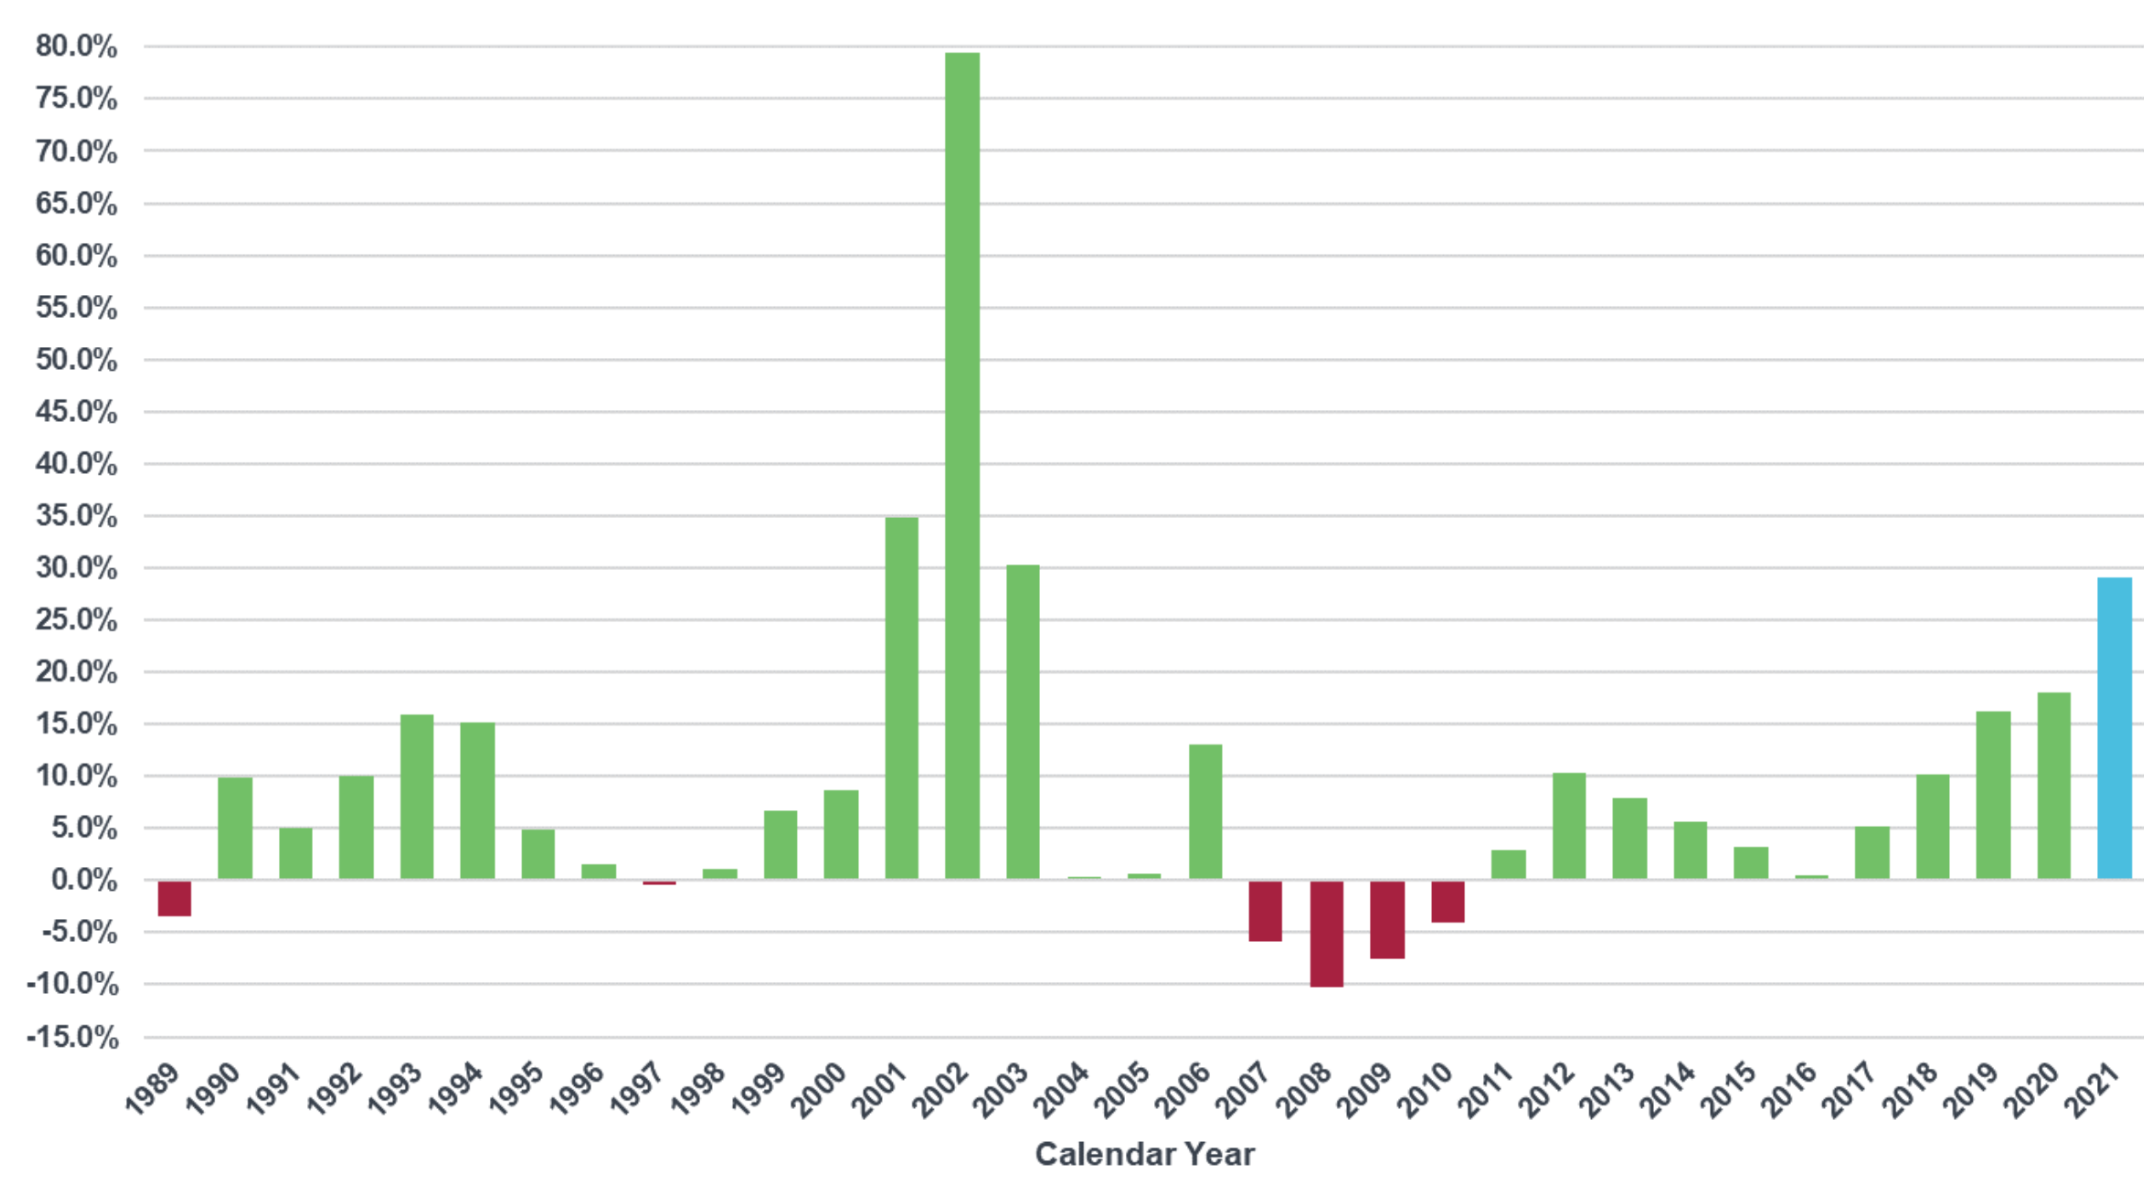
The 2021 annual growth rate of 29% displayed in Chart 1 is based on surveyed results for the E&S cohort and is therefore shaded blue to denote its approximation for the larger E&S market. The actual 2021 growth rate for the E&S market will not be known until all 2021 annual statement data has been reported and compiled. Nevertheless, we believe the 29% growth rate derived for the E&S cohort is a fair representation, considering it made up 81% of the E&S market in 2020.
The 2021 estimated annual growth rate is the fourth-largest growth rate observed over the last 33 years, trailing only the post 9/11 hard market growth rates in 2001 (35%), 2002 (79%), and 2003 (30%).
If the estimated 2021 annual growth rate is realized, the total DWP for the E&S market would exceed $60 billion as illustrated in Chart 2 below:
Chart 2: E&S Market DWP by Calendar Year
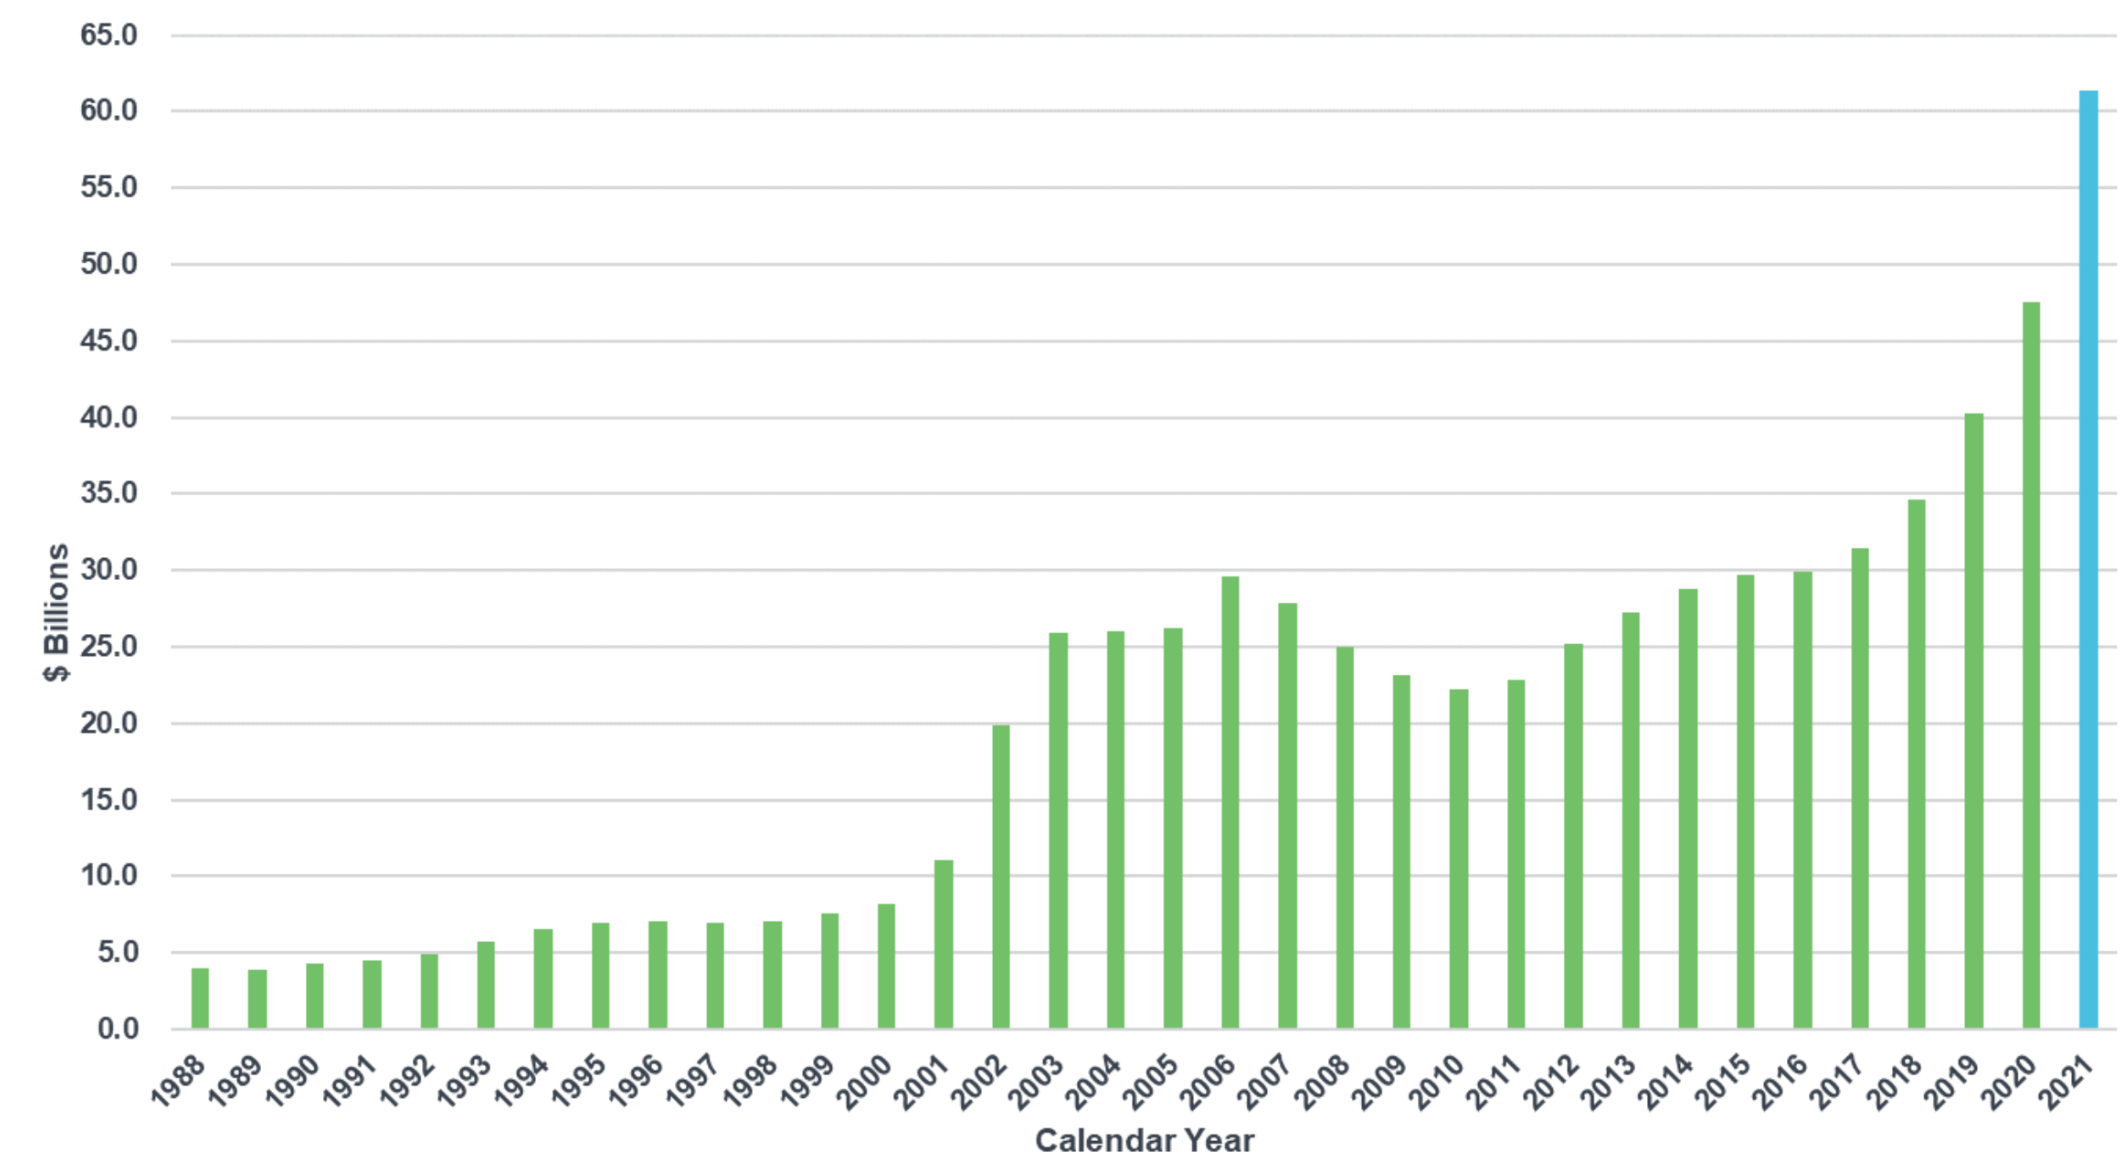
Note: Calendar year data for 2007 and prior was taken from Best's Special Report, U.S. Surplus Lines, dated Sept, 23, 2013. Calendar year data for 2008 and subsequent was provided by S&P Global Market Intelligence.
See also: Choose Your Companies Carefully
One-Year Reserve Development
Chart 3 below displays a long-term view of the ratio of one-year reserve development for the E&S cohort across all lines of business; where the ratio is calculated as the one-year change in net ultimate loss and defense and cost containment expense (as measured by Annual Statement, Schedule P – Part 2) divided by net earned premium (as measured by Annual Statement, Schedule P – Part 1):
Chart 3: E&S Cohort Ratio of One-Year Reserve Development by Calendar Year
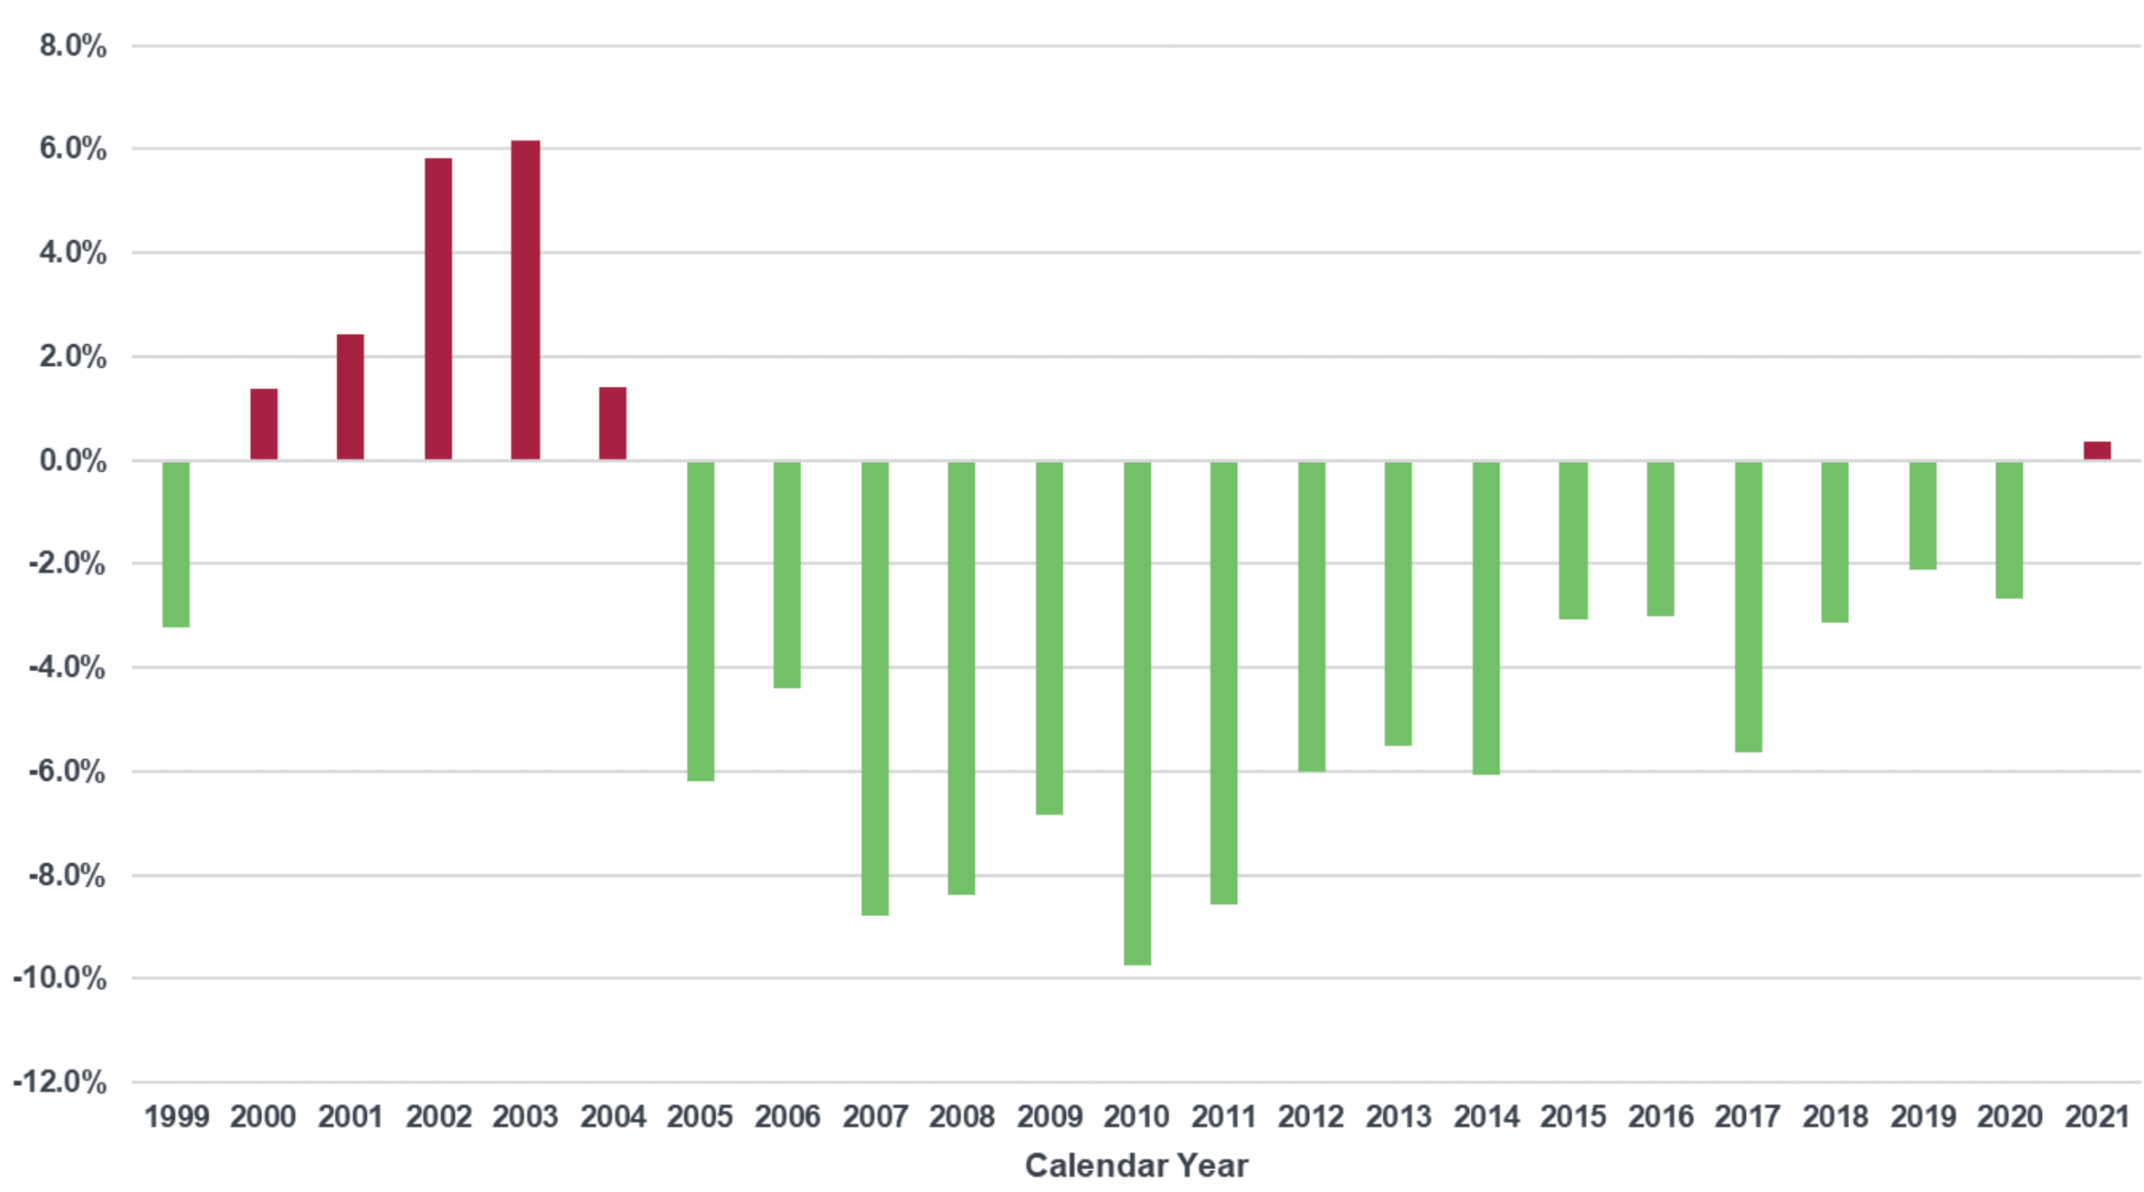
As displayed in Chart 3, the E&S cohort has experienced an extended period of reserve releases beginning in calendar year 2005 and extending through 2020, with the magnitude of the reserve releases generally trending smaller in recent years. The results from our preliminary survey suggest calendar year 2021 marks the first year of adverse one-year reserve development for the E&S cohort since 2004. Though 2021 reflects a relatively small amount of adverse reserve development (i.e., 0.4% of 2021 net earned premium), this result follows an extended period of reserve releases, not to mention its signal as a potential inflection point in the reserve cycle.
Chart 4 bifurcates the ratio of one-year reserve development for calendar year 2021 into its component coverage years:
Chart 4: E&S Cohort Calendar Year 2021 Ratio of One-Year Reserve Development – Coverage Year Contribution
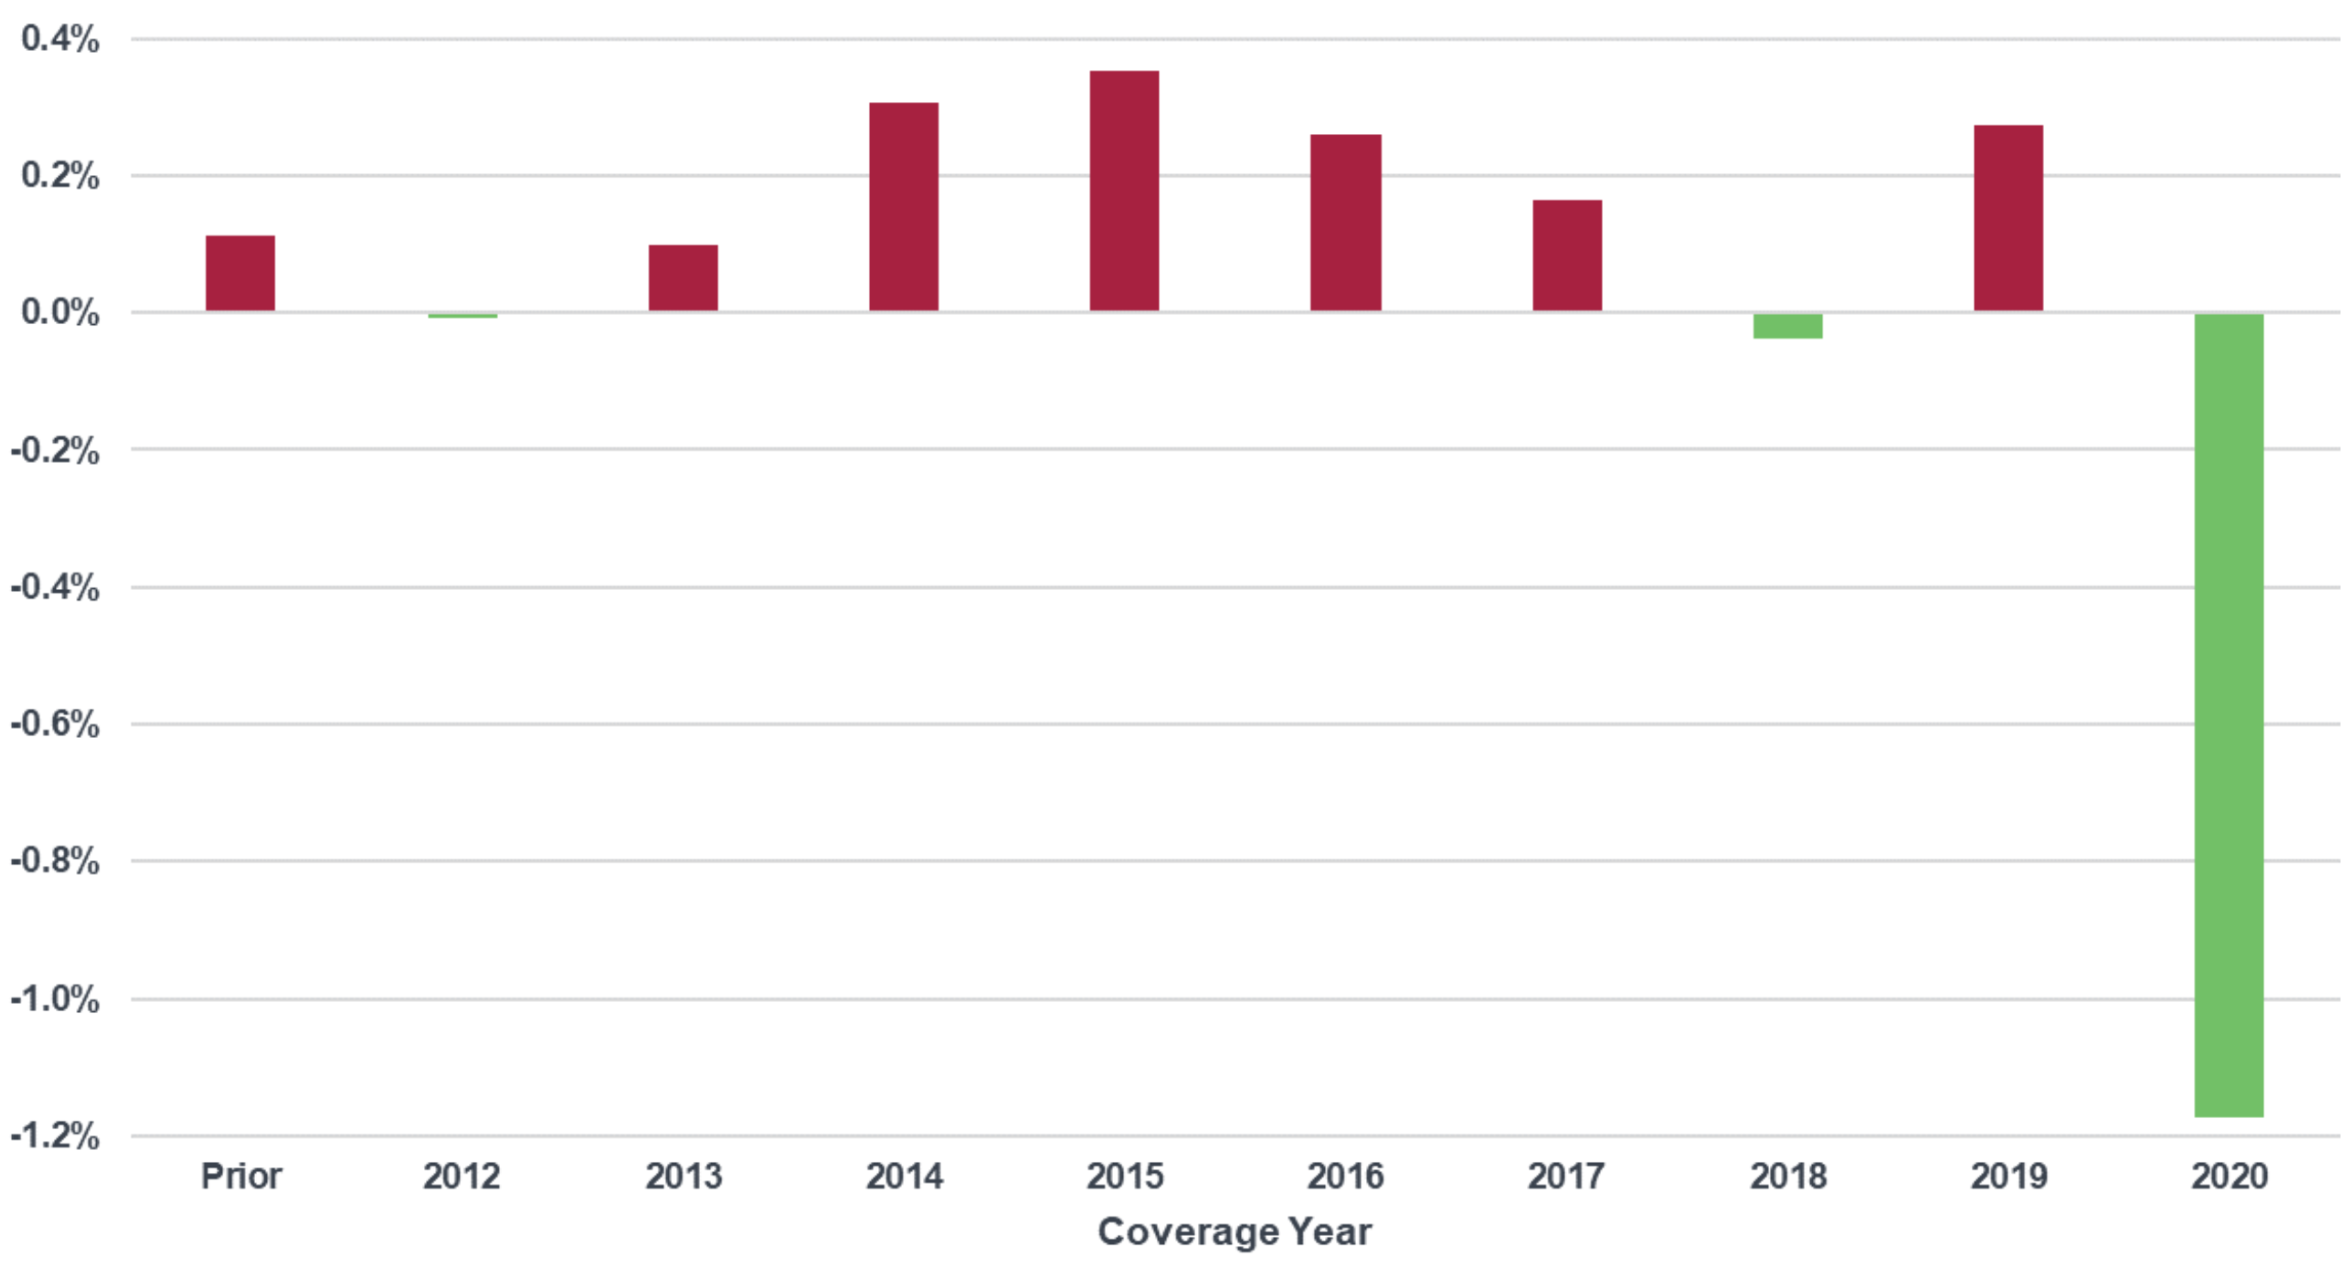
As displayed in Chart 4, coverage years 2019 and prior have generally experienced adverse reserve development in 2021, whereas coverage year 2020 has experienced favorable reserve development.
The favorable experience in coverage year 2020 nearly offset the adverse development observed elsewhere, as illustrated in Table 1 below:
Table 1: E&S Cohort Calendar Year 2021 Ratio of One-Year Reserve Development – Coverage Year Contribution

Though the favorable reserve development observed in coverage year 2020 is likely attributed to a number of factors, we suspect the main driver stems from reduced exposure to loss during the height of the COVID-19 pandemic (i.e., shutdowns and related initiatives may have resulted in reduced insured “activity” relative to premium charged, even after COVID-19 related premium refunds) as well as rate increases that began late in 2019 that may have not been fully recognized in the reserve setting process as of Dec. 31, 2020.
Other Liability — Occurrence Experience
The largest line of business for the E&S cohort (as measured by DWP) has historically been Other Liability - Occurrence. Chart 5 below displays the E&S cohort’s sequential development of booked D&A ultimate loss and LAE ratios for this line of business over the last five coverage years (as measured by Annual Statement, Schedule P – Part 1):
Chart 5: E&S Cohort Booked D&A Ultimate Loss and LAE Ratios – Other Liability Occurrence
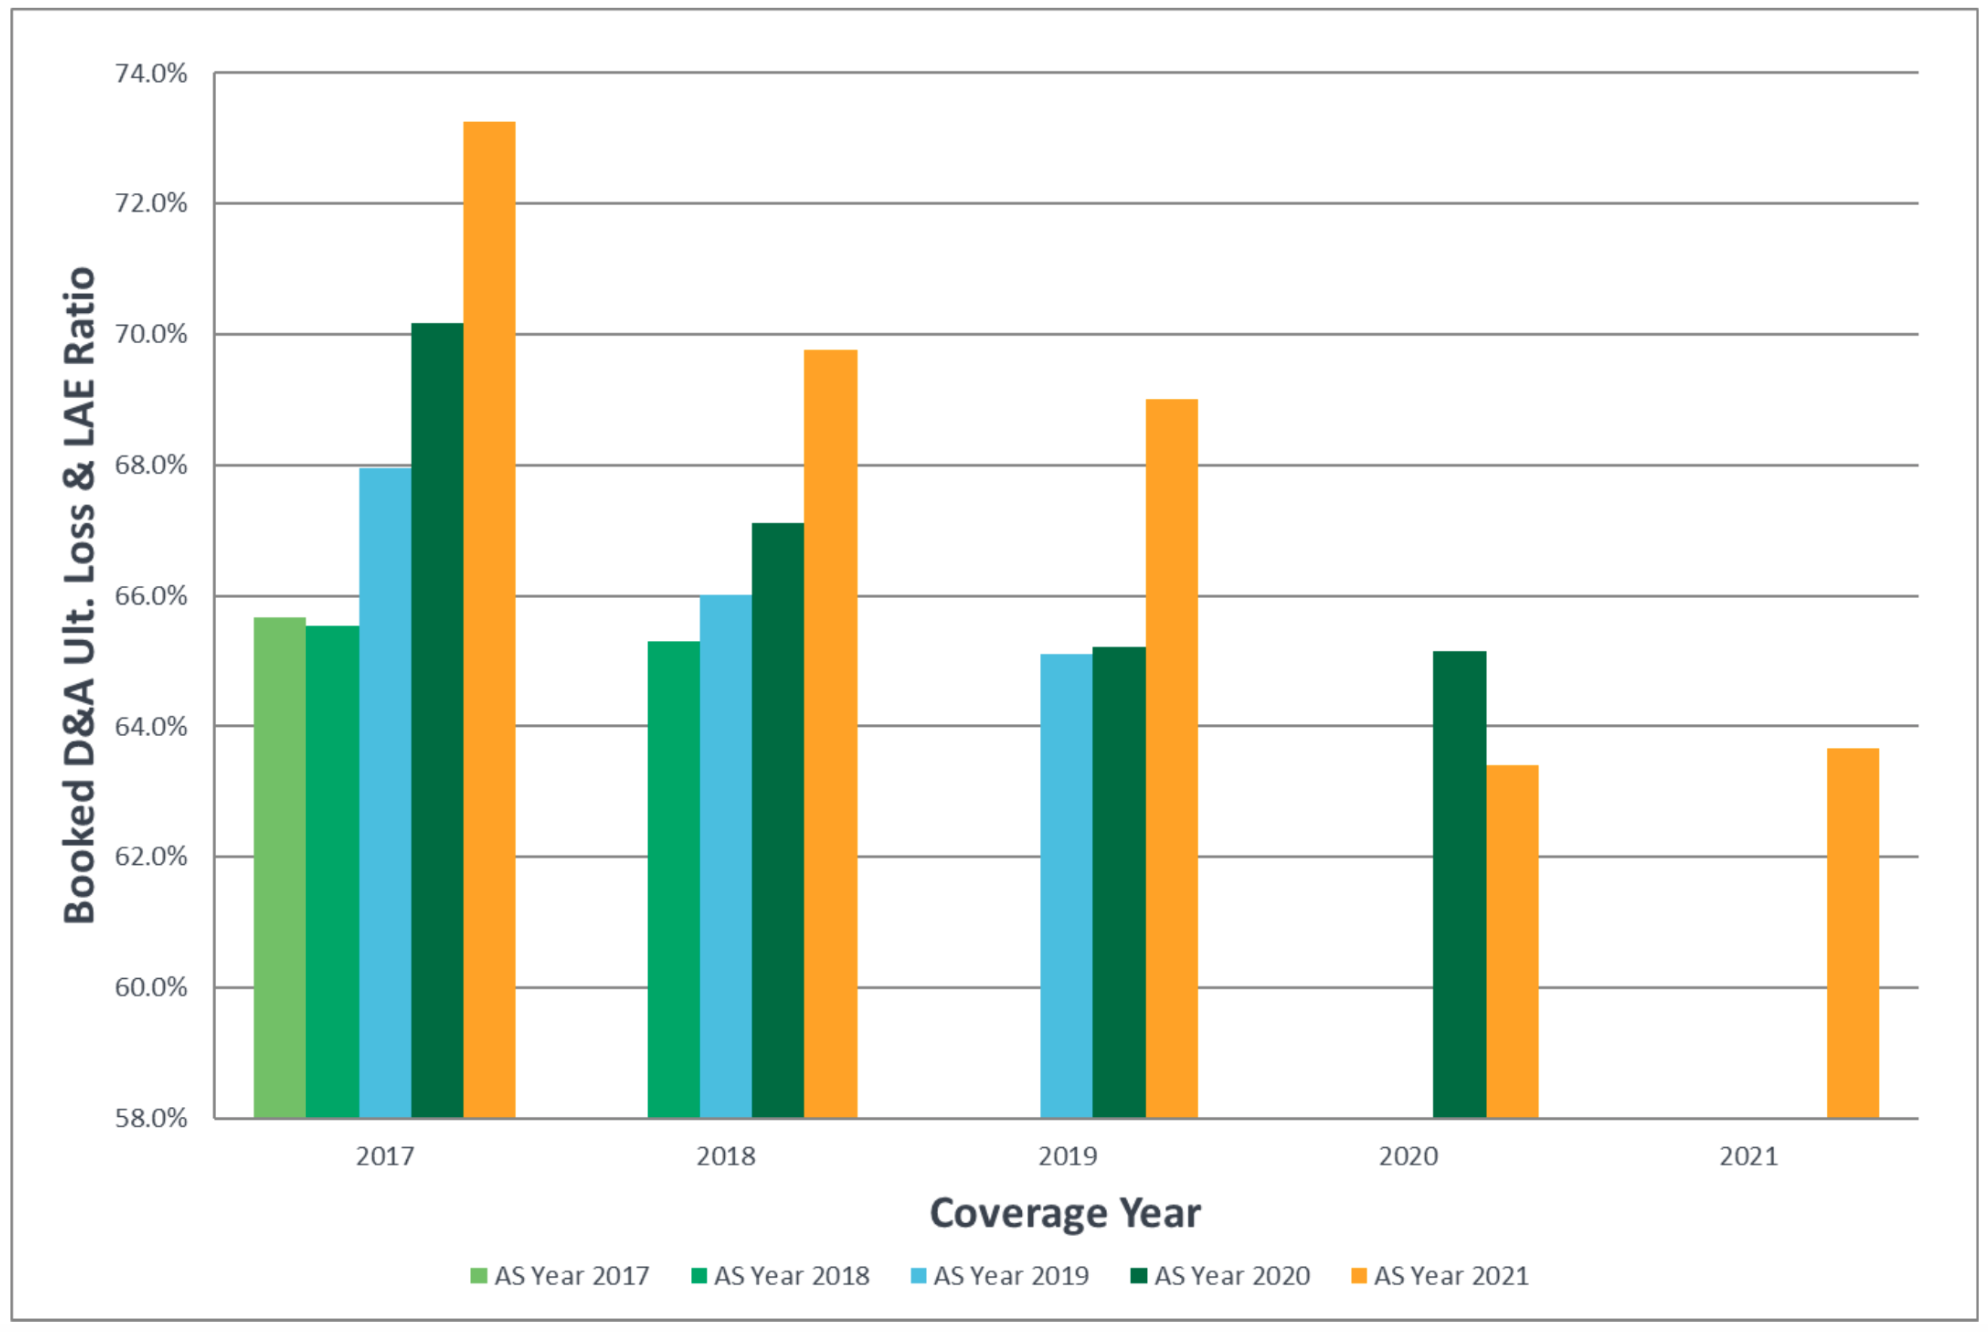
As displayed in Chart 5, coverage years 2017, 2018 and 2019 have developed adversely in calendar year 2021, whereas coverage year 2020 has developed favorably. These observations generally align with the trends in one-year reserve development discussed in the previous section.
Specifically, the booked ultimate loss and LAE ratio for coverage year 2017 has increased 7.6% from the initial booked ratio at 12 months of development (as of Dec. 31, 2017). Likewise, coverage years 2018 and 2019 have increased 4.5% and 3.9% from their respective initial booked ratios at 12 months of development. It is likely that a portion of these increases stem from increased severity trends.
The year-end 2021 booked ultimate loss and LAE ratios for coverage years 2020 and 2021 are significantly lower than the corresponding ratios for the preceding coverage years. This may not be a surprising result considering the widespread double-digit rate increases experienced within the E&S market over the last 18 to 24 months.
Despite the recent rate increases, the coverage year 2021 booked ultimate loss and LAE ratio as of Dec. 31, 2021 is marginally higher than the corresponding booked ratio for coverage year 2020. Based on this observation alone, one may initially suspect coverage year 2021 has a good chance to develop favorably over the next several years, working to offset any adverse development stemming from the prior coverage years. However, we caution the reader against that conclusion, considering the unique nature of coverage year 2020, where exposure to loss was likely reduced on account of shutdowns and related initiatives.
See also: How to Use Social Media Data in Underwriting
Concluding Remarks
At this point, we believe that the hard E&S market will not end any time soon; however, some companies will struggle with prior year reserving issues.
All data referenced in this article was provided by S&P Global Market Intelligence, unless otherwise noted.
For further information, please reach out to the authors.
To request a copy of our full E&S study based on complete 2021 Annual Statement data (or to request prior such studies), please contact zachary.ballweg@milliman.com. We anticipate the 2021 study will be ready for release in mid-May.


