Deterioration of accident year 2016-2019 reserves
The adequacy of reserves is a critical issue for the property and casualty (P&C) insurance industry, as it affects the profitability, solvency and reputation of insurers. Reserves are estimates of future liabilities based on past claim experience and actuarial assumptions. These estimates are subject to uncertainty and may change over time due to various factors, such as changes in claim frequency and severity, changes in legal environment, changes in social attitudes and changes in economic conditions. These factors may cause the actual payments to differ from the expected payments, resulting in reserve development, which can be either favorable or unfavorable.
One of the factors that has been widely discussed in recent years is social inflation, also called legal system abuse, which refers to the phenomenon of rising litigation costs, higher jury awards and broader contract interpretations that increase insurers' liabilities beyond their original expectations. Social inflation can have a significant impact on the reserve adequacy of P&C segments, especially in lines of business that involve long-tail claims, such as liability lines. In this article, we analyze the trends and patterns of reserve development in P&C segments, with a focus on the effects of social inflation and other factors that affect the adequacy of reserves. We will focus on the causes of adverse reserve development in the 2016-2019 accident years and what this means for future development in more recent accident years.
Adverse reserve development in the 2016-2019 accident years of liability segments could be a precursor to the deterioration of 2020 and subsequent. As can be seen in Figure 1, the booked net ultimate loss ratios in the Other Liability Occurrence line of business for the U.S. P&C industry for accident years 2016-2019 have developed adversely every calendar year since they were initially established (the initially established reserves are represented by the yellow bar at 12 months of development in Figures 1 to 3). The net ultimate loss and defense and cost containment expense (DCCE) ratios for the Other Liability Occurrence line of business have increased six to 10 loss ratio points depending on the accident year between the initial estimate after 12 months of development and the most recent estimate at year-end 2023. Other Liability Occurrence is not alone in experiencing development in accident years 2016 through 2019. Other Liability Claims Made has also seen almost universal adverse development in report years 2016 through 2019, with loss and DCCE ratios in report years 2018 and 2019 developing more than 13% and 8%, respectively. See Figure 2. The Commercial Auto Liability industry net loss and DCCE ratios for the 2016-2019 accident years have seen strengthening of over 10% since they were initially established. See Figure 3. Our analysis focused on industry aggregate net results, as net results are currently available. We suspect that direct results will display even more adverse development due to nuclear verdicts that would have a greater impact on the reinsurance layer. Direct results are not currently available but will be available in a month.
See also: Insurers' Social Inflation Problem
Figure 1: Aggregated Other Liability Occurrence Industry Data From 2016-2023 Year-End Schedule Ps

Figure 2: Aggregated Other Liability Claims Made Industry Data From 2016-2023 Year-End Schedule Ps
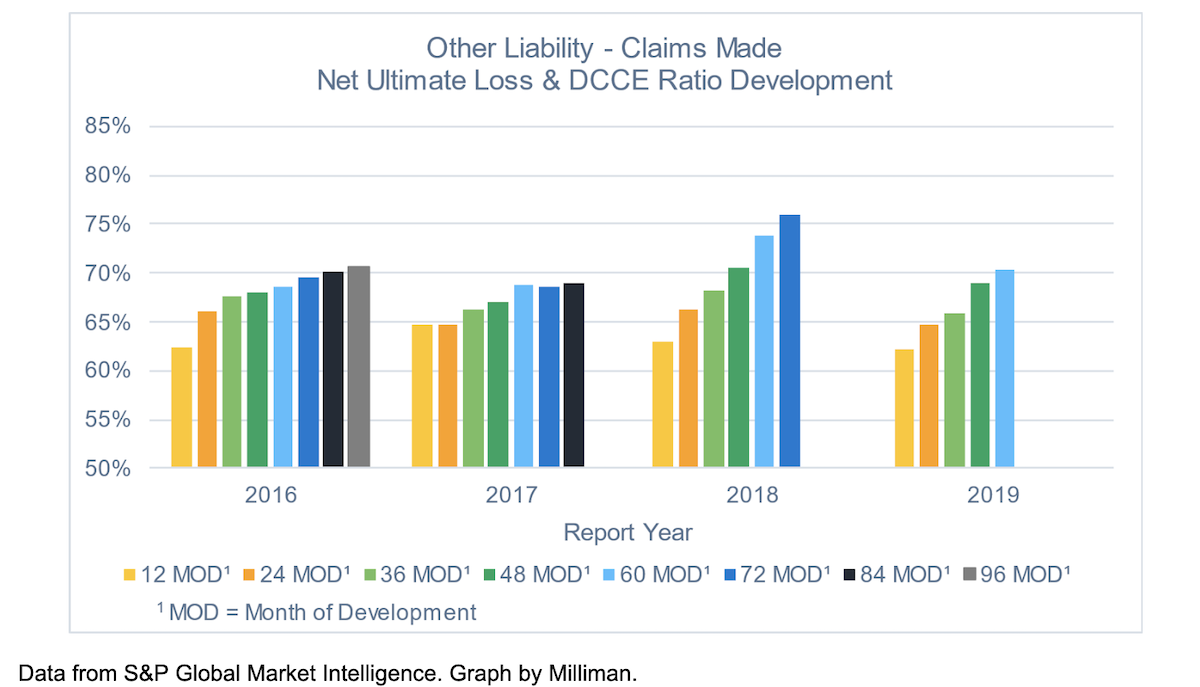
Figure 3: Aggregated Commercial Auto Liability Industry Data From 2016-2023 Year-End Schedule Ps

Some insurers’ press releases include comments on social inflation increasing prior accident/report years’ reserves. When commenting on 2023 financial results, Vince Tizzio, president and CEO of AXIS Capital, said, “The decisive actions we are taking this quarter address reserve development that is predominantly related to 2019 and older accident years, as current economic and social inflation trends impact the overall U.S. casualty market. We undertook a rigorous review that included an examination of trend assumptions, emerging development patterns, new industry data and current legal trends.” AXIS Capital’s president is not the only one pointing to social inflation. Everest Re’s CEO, Juan Andrade, noted that Everest Re strengthened insurance segment reserves by $392 million for the impact of social inflation on long-tail lines with a focus on the 2016-2019 accident years. While not all point to social inflation as a root cause, companies are noting latent development in the 2016-2019 accident/report years in their press releases.
See also: What to Do About Rising Inflation?
Social inflation – the driver of latent reserve development
The large development of more seasoned reserves stems at least in part from components of social inflation such as juror sentiments, nuclear verdicts, third-party litigation funding and evolving legal tactics.
Juror sentiments and nuclear verdicts
The 2007-2008 global financial crisis damaged people's trust in corporations, and many people now want to see big corporations pay more for their actions. This has led to higher-severity claims, especially in lines of business where lawsuits can be framed as a corporation against an individual. We are defining nuclear verdicts as those with a settlement over $10 million. Nearly two-thirds of the nuclear verdicts in personal injury and wrongful death cases studied by the U.S. Chamber of Commerce Institute for Legal Reform over a 10-year period came from product liability (24%), auto accidents (23%), and medical liability (21%) cases. Commercial Auto Liability has experienced nuclear verdicts for many years now; however, 2021 brought a new landmark, a $1 billion wrongful death verdict against two trucking companies found to be negligent. As nuclear verdicts become more and more prevalent, nuclear award amounts are reported by the media, making very large verdicts feel more mainstream to potential jurors regardless of whether the plaintiff is able to collect the full verdict amount. This rise of nuclear verdicts is contributing to rising social inflation.
Third-party litigation funding
Jury attitudes are not the only factor in the increase in nuclear verdicts. Third-party litigation funding (TPLF) also continues to drive up the cost of claims. TPLF is when an external party invests capital in the litigation process in exchange for a portion of the settlement amount. The rise of TPLF has created larger verdicts as plaintiffs are able to pursue cases with stronger funding for longer periods. Just between 2019 and 2022, the TPLF market grew by 44% in the U.S. This market growth shows no signs of slowing, which will likely compound the upward pressure on liability severities. According to Swiss Re, TPLF-funded cases generated average internal rates of return of between 20% and 35% in 2019 and 2020. The rates of return on TPLF outperform those of risky asset classes such as venture capital and private equity. The TPLF market rose to $17 billion in 2021, with over 50% of that occurring in the U.S. Nine states have pending legislation regarding TPLF. The pending legislation in many states is aimed at requiring disclosure of TPLF to a jury as well as consumer protections. While this is a start, it may be quite some time before we see TPLF legislation soften the impact of TPLF on claim severity. TPLF thrives in environments where the plaintiff can be seen as the little guy against a big corporation, such as Commercial Auto and Professional Liability lines.
Evolving legal tactics – a defense attorney’s perspective
Inflation—both social and economic—continues to drive settlements and judgments higher. Although inflation seems to have cooled from its 2022 high, it continues to take a toll on consumer sentiment and the cost of resolving claims. Law firms, experts and vendors are still increasing hourly rates to keep up with inflation, which serves to drive up the projected cost of defense beyond initially projected budgets. Social inflation is going hand in hand with that and also driving up costs. As nuclear verdicts desensitize potential jurors, we have seen plaintiffs’ firms acting more bullish about jury trials and the potential for excess of policy judgments. Plaintiffs also seem to be using inflation to increase their models of alleged damages to put pressure on pretrial settlements. These phenomena are part of the cause of a substantial increase in claim severity in professional liability lines.
In light of plaintiffs’ increased expectations, we are seeing evidence that it is harder to resolve professional liability claims, as plaintiffs seek larger monetary compensation than they have in the past. Mediators have reported that it is rare these days for complex professional liability cases to settle early, before considerable expense is incurred. Why there is a sudden divergence in case assessments is unclear, but what it means is that cases are dragging on for longer than they have in the past, especially large, eight- and nine-figure cases, where plaintiffs are refusing to settle early for fear of leaving any money on the table. This is especially in line with cases involving failed or bankrupt companies, as investor and creditor losses can be substantial and lawyers and accountants are viewed as ”insurance policies” when things go wrong. Investors who have lost money in bad deals often feel entitled to compensation from professional advisers, even when they struggle to link any acts by the professional advisors to the ultimate losses. Further, the judiciary seems disinclined to accept strong legal defenses such as in pari delicto and grant dispositive motions. What this means is that more cases are going all the way through discovery and into trial—or at least to the courthouse steps—substantially increasing the defense spending and ultimate cost of a claim.
Furthermore, regulators seem to be affecting claim inflation, as well. According to a recent Cornerstone Research article, the number of accounting and auditing enforcement actions increased 22% in fiscal year 2023 over 2022. This is affecting publicly traded companies as well as their professional service providers, and there has been a marked increase in claim notifications involving claims, subpoenas, inquiries or other actions by regulators against professionals. Although fines and penalties from such actions are not always covered by professional liability policies, the cost of investigating and defending these claims is, and that is also increasing the overall cost of liability claims.
What does this mean for future reserves?
The adverse development trends in these liability lines lead us to question whether we will see similar deterioration in reserves for the 2020-2023 accident years. Unfortunately, the adverse reserve development may not be limited to the 2016-2019 accident/report years. Many actuarial methods rely on the loss ratios or ultimate losses from more mature accident/report years to predict the ultimate losses on recent accident/report years, where very little is known from actual claim data. Therefore, the deterioration of the 2016-2019 reserves could mean that more recent years might also undergo a similar period of adverse development, as pricing estimates in more recent years initially relied on the 2016-2019 years. The Other Liability Occurrence industry-weighted average booked loss and DCCE ratio at 12 months of development for the 2020 through 2023 accident years is 64%, which is slightly below where the weighted average 2016 through 2019 booked net ultimate loss and DCCE ratio started out at 12 months of development (65%) and significantly below where the 2016 through 2019 booked net ultimate loss and DCCE ratios were at year-end 2023 (72%). Likewise, Other Liability Claims Made and Commercial Auto Liability also have initially established weighted-average loss and DCCE ratios for the 2020-2023 period that are similar in magnitude to the initially established weighted-average loss and DCCE ratios from 2016-2019, which have developed significantly since their establishment. This is exhibited in Figure 4. There have been significant rate increases over the past few years, which might mean the 2020-2023 ultimate loss ratios are not overly optimistic. However, only time will tell where loss ratios will ultimately settle.
See also: A Tipping Point for P&C Litigation
Figure 4: Net Ultimate Loss and DCCE Ratios by Accident/Report Year at 12 months of Development and at 12/31/2023 (from 2016-2023 year-end Schedule Ps)
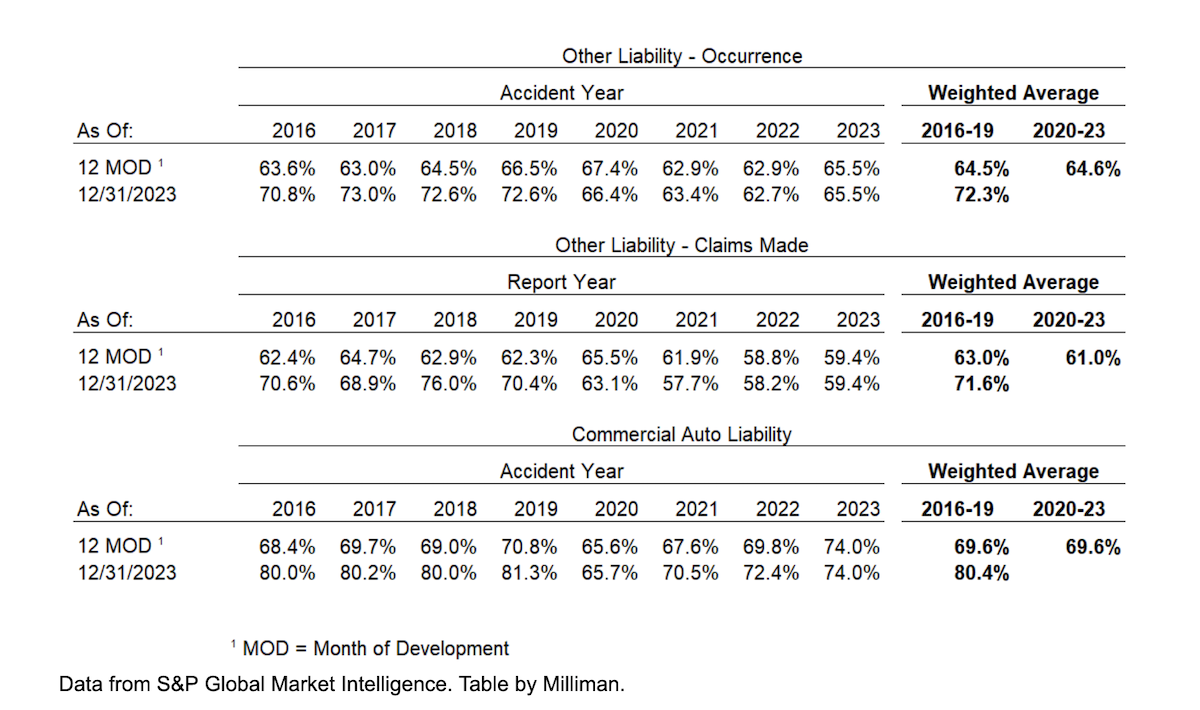
As of year-end 2023, accident year 2020 for Other Liability Occurrence, Other Liability Claims Made, and Commercial Auto Liability have seen adverse development in the last 12 months. However, as of year-end 2023, the 2021 and subsequent net ultimate loss and DCCE ratios for Other Liability Occurrence and Other Liability Claims Made have experienced negligible adverse development. The same cannot be said of Commercial Auto Liability which has already seen its 2021 loss and DCCE ratios deteriorate from 69% to 71%, and its 2022 ultimate loss and DCCE ratios deteriorate from 70% to 72%. Figure 5 displays the development of the Other Liability Occurrence, Other Liability Claims Made, and Commercial Auto Liability net ultimate loss and DCCE ratios over the past 12 months.
Figure 5: Development of Net Ultimate Loss and DCCE Ratios by Accident/Report Year Between 12/31/2022 and 12/31/2023 (from 2022 and 2023 year-end Schedule Ps)

Juror sentiments, nuclear verdicts, TPLF and evolving legal tactics have given rise to social inflation. Social inflation’s influence has been prevalent in the Other Liability Occurrence, Other Liability Claims Made and Commercial Auto Liability lines of business. In recent years, these lines of business have seen a deterioration of the 2016-2019 net ultimate loss and DCCE ratios. Only time will confirm whether more recent accident/report years will deteriorate under the pressure of social inflation as the 2016-2019 accident/report years have deteriorated.

