The Equal Ventures Insurance Index is a quarterly summary of public equity performance in the P&C insurance industry. This post summarizes performance of our insurtech/legacy indices in Q1 2024, highlighting key themes and trends in valuations.
Q1 was a strong quarter for stocks, and particularly so for the P&C insurance industry. 10Ks that hit during the quarter confirmed that the industry appears to be turning a corner on profitability. Capital is flowing again toward the hardest risks (Chubb called property the “best-priced business in the world”), and there were explosive stock price increases at insurtechs that demonstrated higher-quality growth.
Q1 2024 Summary Stats:
- Insurance equities broadly performed well in Q1: All four of our indices outperformed the broader market (SPX + 10%; Nasdaq + 9%)
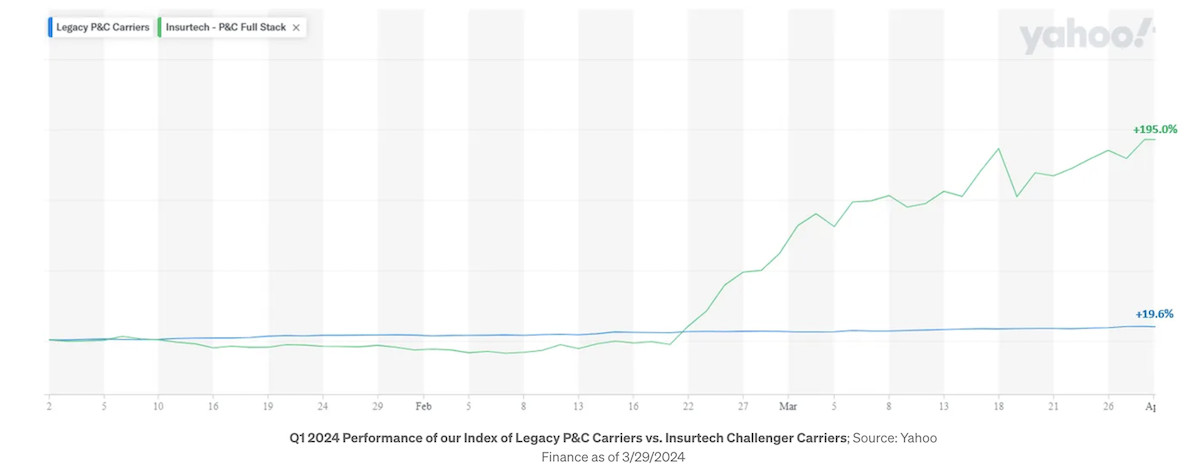
- Insurtechs outperformed legacy peer groups in both distribution and carrier indices, consistent with the trend we saw in Q4 and in FY 2023.
- Carriers generally outperformed as higher rates and lower losses led to stronger results and improved guidance. The Insurtech Carrier Index, in particular, nearly tripled over the quarter, as investors anticipate and try to get ahead of a turnaround in fundamentals.


Takeaways From Q1 Performance:
Improving trends in performance helped P&C carriers outperform throughout Q1 and continue the strong trend we wrote about last quarter. As we’ve talked about before, after facing a string of tough quarters in 2023, carriers have been focused on improving their combined ratios (from a terrible ~104% in 2023) by culling their books and taking higher rates. As premiums inch higher and property losses subside (at least for now), the strategy is paying off as profitability expectations rise. Every stock in both of our carrier indices was up in Q1, and the ACORD NA P&C Insurance Index posted a total return >40%. These are the sorts of numbers that look more like high-beta tech than insurance carriers.

PGR (+30% in Q1), for example, in January reported a beat on combined ratio and net income in its fourth quarter results. FY combined ratio of 94.9 was ahead of its 96.0 forecast, and premiums rose by >20% y/y. The company pointed to an “unusually low frequency” of losses in the month of December 2023, driven by business mix and mild weather. The trend continued in Q1 results (albeit reported in Q2), with the combined ratio improving further to 86.1, a close to 13ppt improvement y/y and 250bps improvement sequentially over Q4’s strong result.
But it’s the insurtech carriers, led by ROOT (+483%!!), that benefited most from the perceived inflection point in growth and operating loss. Combined ratio (though still >100%) improved by a staggering 68 points y/y, and GWP more than doubled. Premiums from new business were up close to five-fold, and share of premiums from renewals ~halved compared with Q4 2022 (as the company churns its higher-risk insureds and builds a seemingly higher-quality book).

In this backdrop of material business improvement, ROOT (which had negative EV just a few quarters ago when we launched the index), was up 13x over a year and >5x in Q1. The bet here is that strong growth will continue in an environment with higher rates, more underwriting discipline and tighter opex compared with 2021. On an EV/revenue basis, for example, ROOT and its insurtech peers still closed the quarter at lower multiples compared with legacy carriers. Our Insurtech Carrier Index traded at 27.5x EV/earned premium in 2021– with EV ~$400 million and given 2023 earned premium at $635 million, ROOT’s valuation is still nowhere near that peak stratosphere. But with its price/book value (arguably the most important metric for a typical P&C carrier) approaching 6x, >3x the median of the legacy group, the market is signaling ROOT can sustain its turnaround in growth and gross profit. Yet even PGR, with a long-term track record of underwriting outperformance in PL auto, trades at a lower multiple. This has led some industry commentators, including our friend Ian, to suggest that issuing equity at this multiple would be accretive to earnings (though the stock is already off its highs from early April).
See also: Social Inflation and Reserve Development
The brokerage and distribution universe was a bit less exciting (as it tends to be), though it still significantly outperformed the market across both indices.

Brokers have benefited from the rapid growth in premiums (and corresponding revenues) over the last year, and Q4 results (reported in Q1) continue to tell that story. GSHD (-12% but still trading at high earnings and revenue multiples relative to incumbents) reported 29% y/y growth in written premium in its February report and anticipates 25% to 30% organic growth in premiums throughout 2024. RYAN (+29%) posted organic revenue growth of 16% in Q4 and 15% for FY 2023 on a revenue and net income base ~8x the size of GSHD’s, showcasing the continued strength of E&S premiums through Q4. As we wrote last quarter, sustained and accelerating pricing growth across the toughest categories (PL auto; property) is constructive to insurance equity performance, and further evidence of this trend in brokers’ earnings reports that hit in Q1 pushed the sector higher.
See also: Digitization and Enablement of Agents
P&C insurance performance in Q1 was impressive — particularly for an industry typically regarded as low-beta or boring. Q1 stock appreciation was standout (even focusing on the legacy players and ignoring the outsized moves of ROOT/HIPO). We remain excited about the growth in profitability as the industry turns a corner toward cyclically higher growth and earnings. But even as rates trend higher and organic growth remains strong, there are already initial signs of rate growth deceleration in Q1, and tougher comps loom (particularly for brokers). Whereas a year ago reinsurance supply was low and rates were skyrocketing, today the multiple of cat bond yields to expected losses suggests that hard market is history. This is sure to keep index performance interesting, and worth commenting upon, in coming quarters.


