Inflation has been top-of-mind since early 2021, and for good reason. For most Americans, the impacts have been inescapable - from the grocery store to the gas pump to the car dealership. Inflation is the highest we’ve seen in 40 years. Auto insurers are struggling to maintain profitability given increases in labor, materials and vehicle replacement costs. And those challenges are only expected to deepen as medical bill inflation accelerates.
History Repeats Itself?
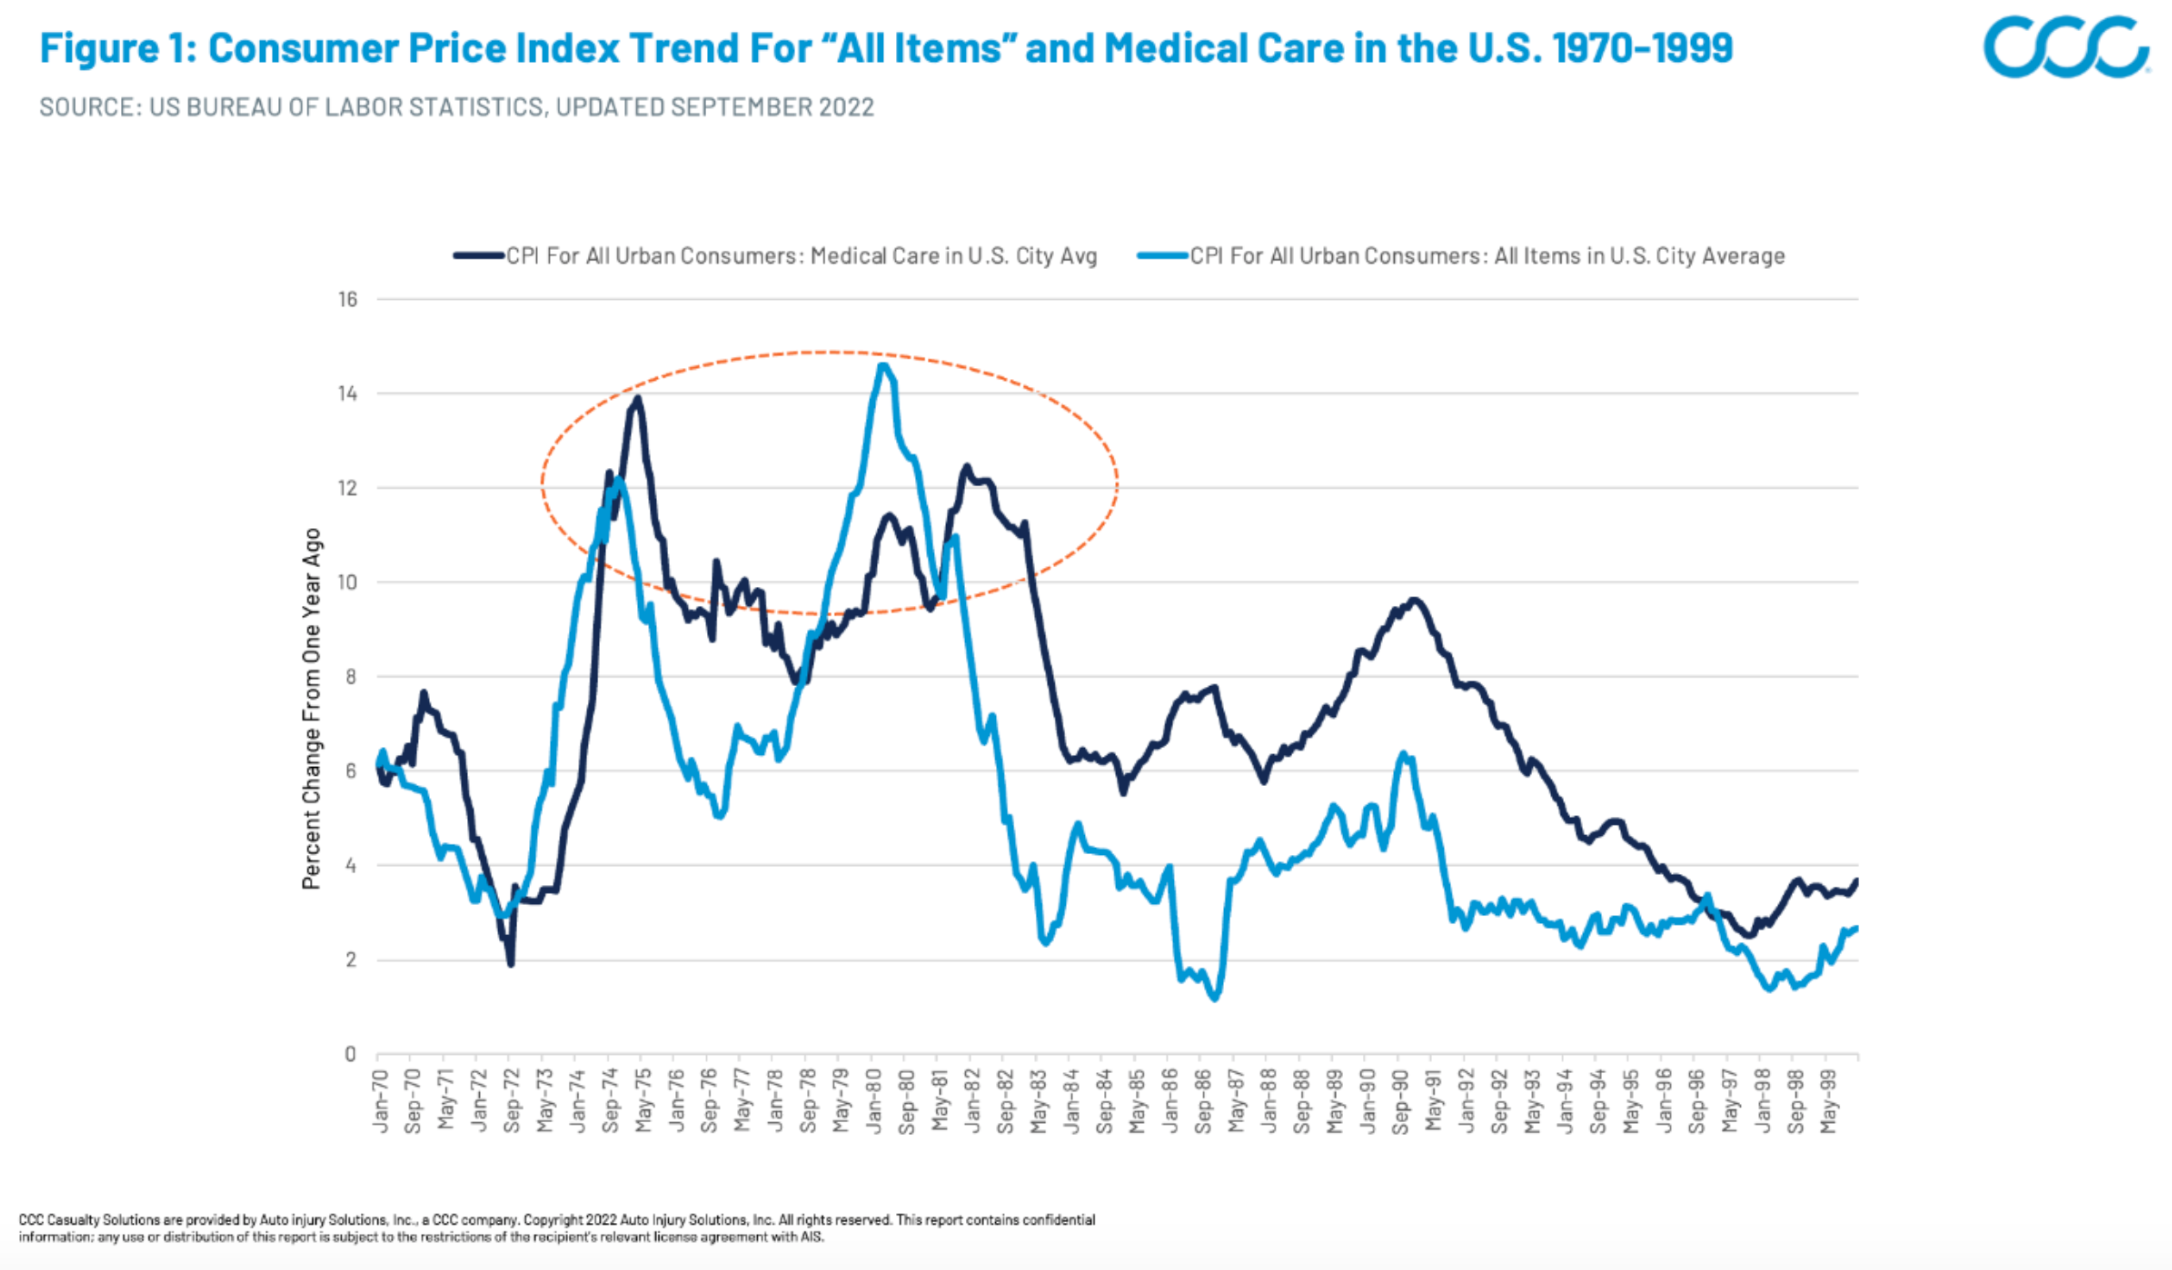
This isn’t the first time that medical care inflation has reacted during periods of high overall inflation. For historical perspective, we need to go all the way back to the recessionary periods of the mid-1970s and early 1980s. Though the specific economic conditions may have been different, we can still draw a few key insights: In general, overall CPI (Consumer Price Index) inflation spikes were followed by similar medical inflation spikes within one to two years (Figure 1), and (Figure 2) the medical increases also stayed elevated for longer periods than overall inflation, which dropped off steeply after peaks.
Figure 1: Consumer Price Index Trend for All Items and Medical Care in the U.S.
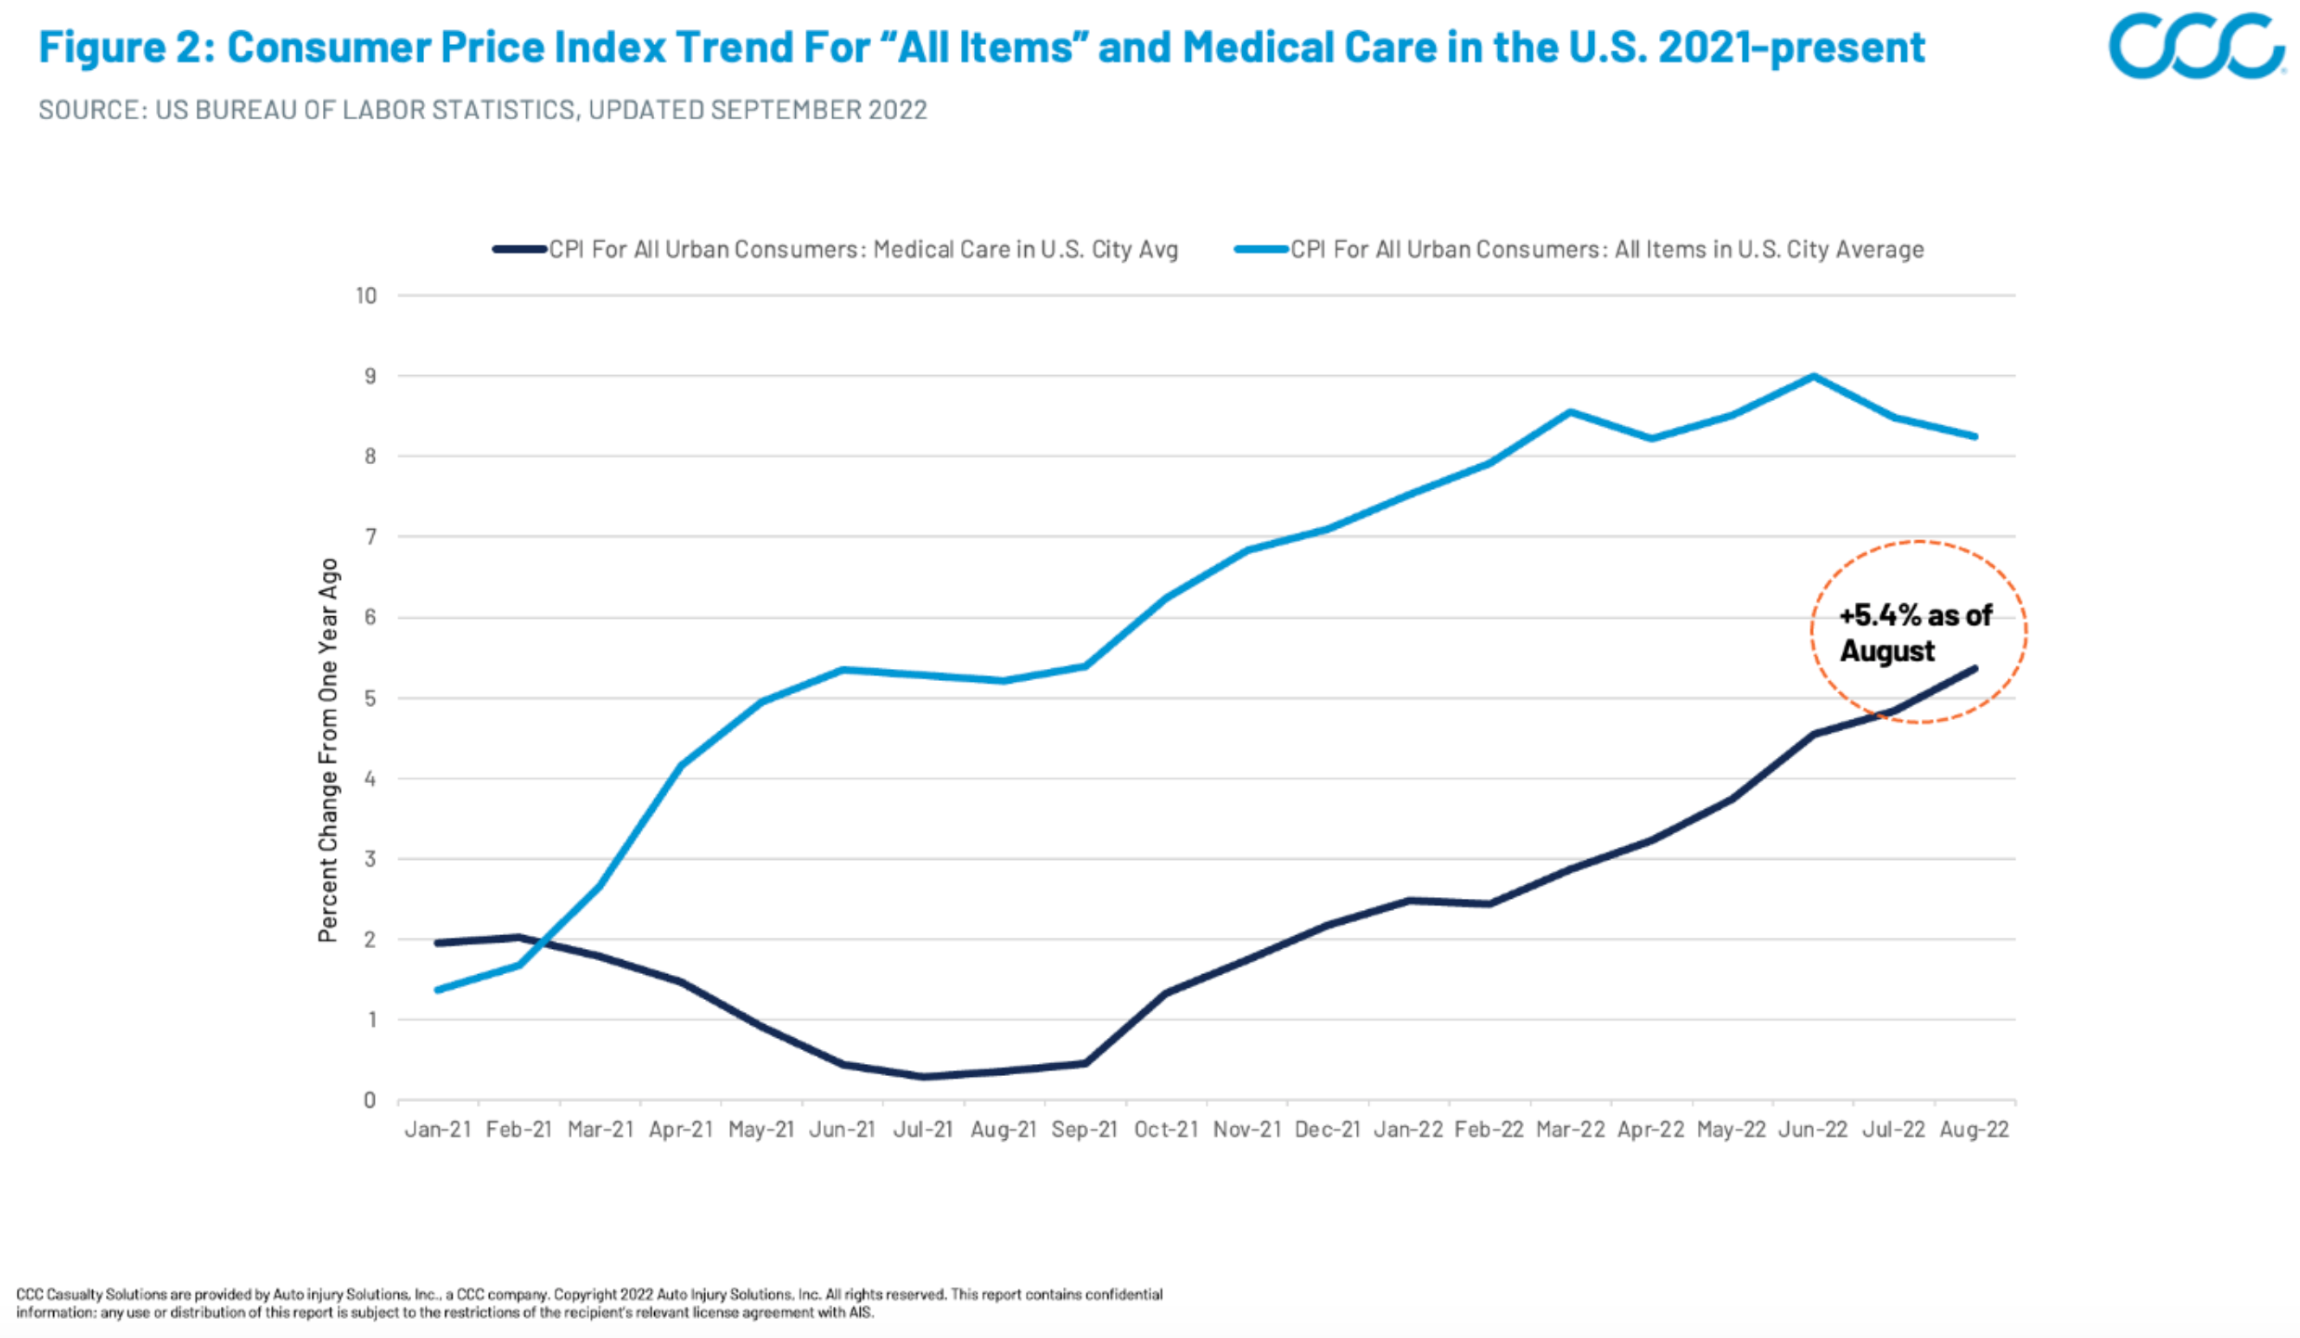
Now, let’s examine this trend in the context of the current landscape. Similar to the historical trend, medical care inflation has trailed overall CPI inflation, mainly because contracts between medical providers and major payers (i.e. Medicare/Medicaid, private health Insurers) are typically negotiated years in advance. This disconnect has placed major financial strains on medical providers locked into reimbursement contracts negotiated prior to the recent inflation increases. But, while medical care inflation reacts slowly compared with volatile items such as food and energy, make no mistake, it is catching up (Figure 2). As of August 2022, U.S. medical care inflation was 5.4% compared with 2021, with a steeply increasing trajectory.
See also: What to Do About Rising Inflation?
Figure 2: Consumer Price Index Trend for All Items and Medical Care Jan 2021 -— Present
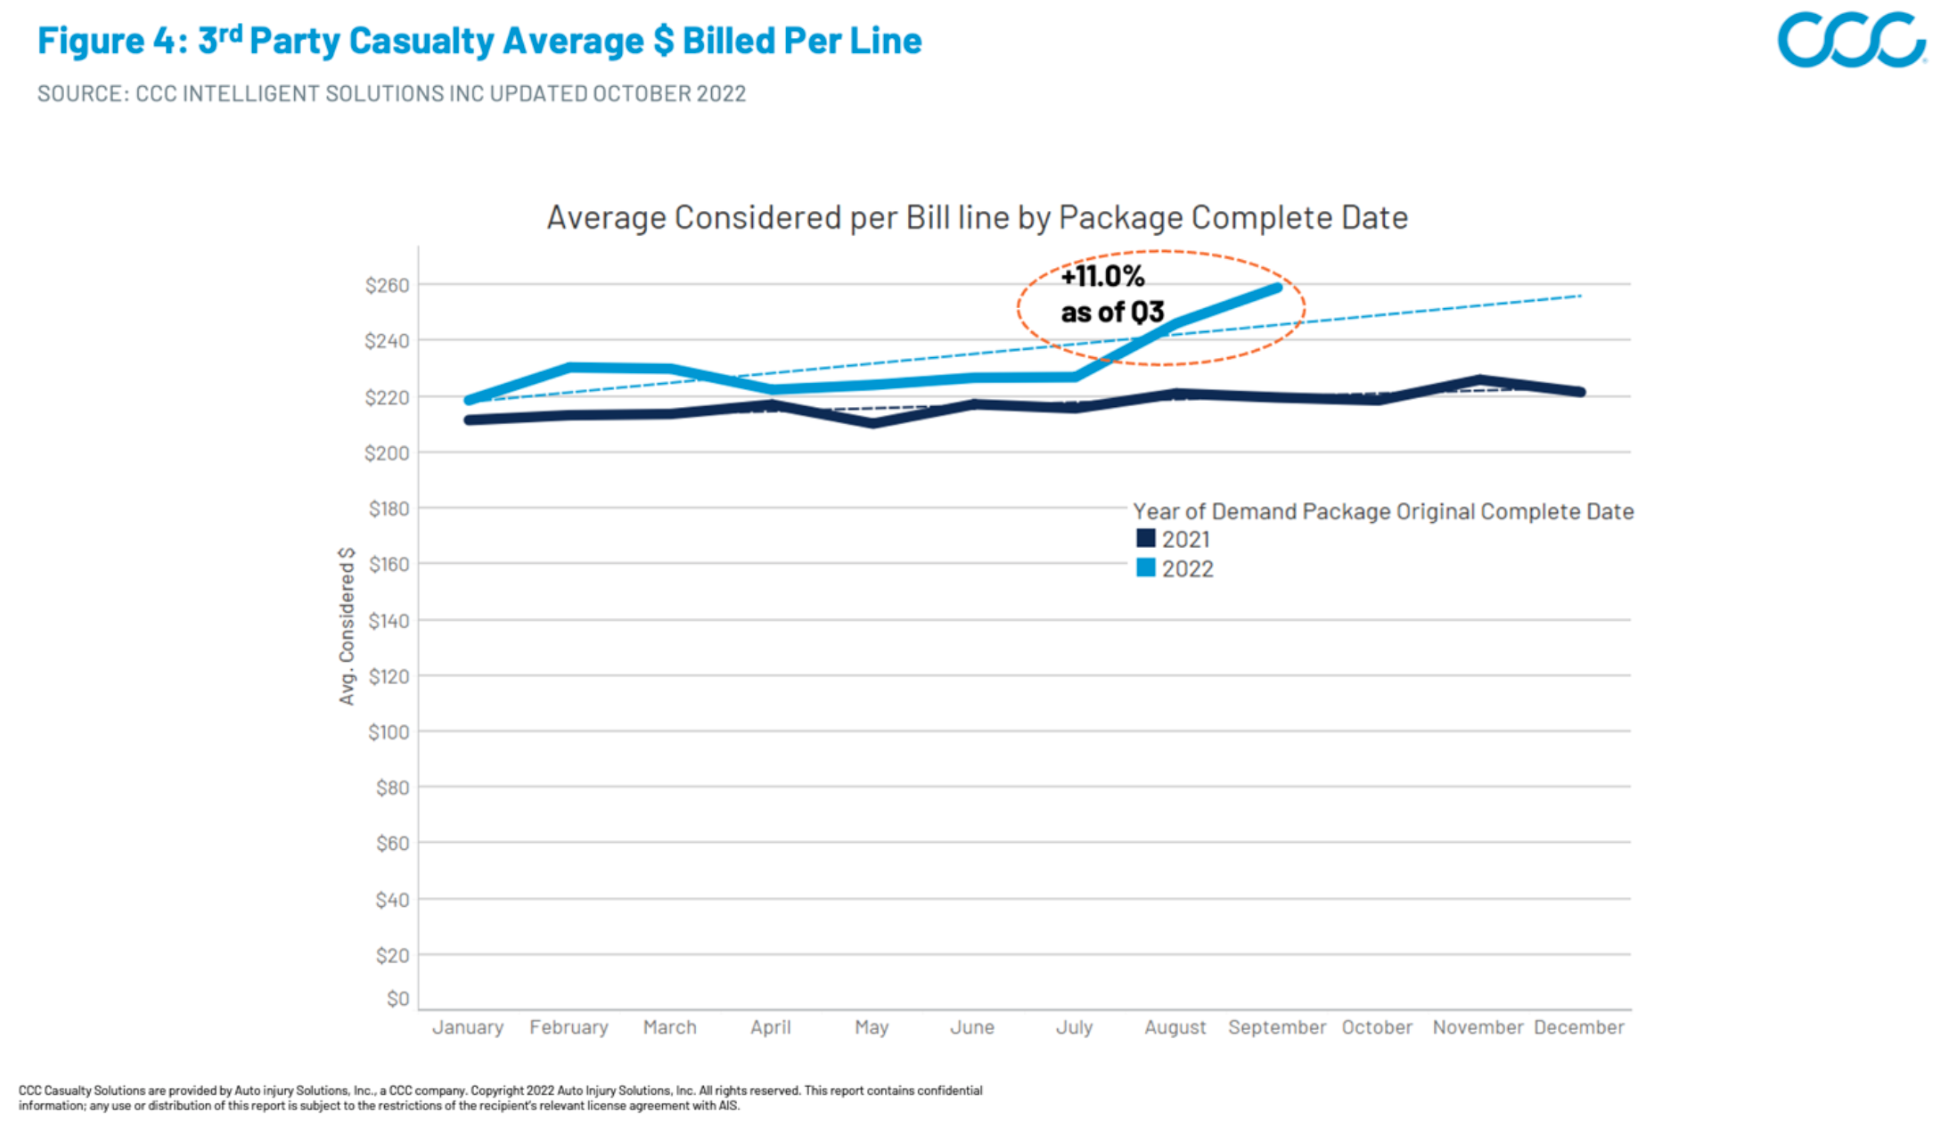
These medical care price increases land heaviest on auto casualty billing because pricing and reimbursement are not tied to major payer contracts. Case in point: We have observed notable billing severity acceleration in Q3 2022 within both our first- and third-party medical bill review data, with first-party average bill severity up 4.2% and third-party average bill severity up 11% compared with Q3 2021 (Figures 3 and 4).
Figure 3: 1st Party Casualty Average Billed per Line
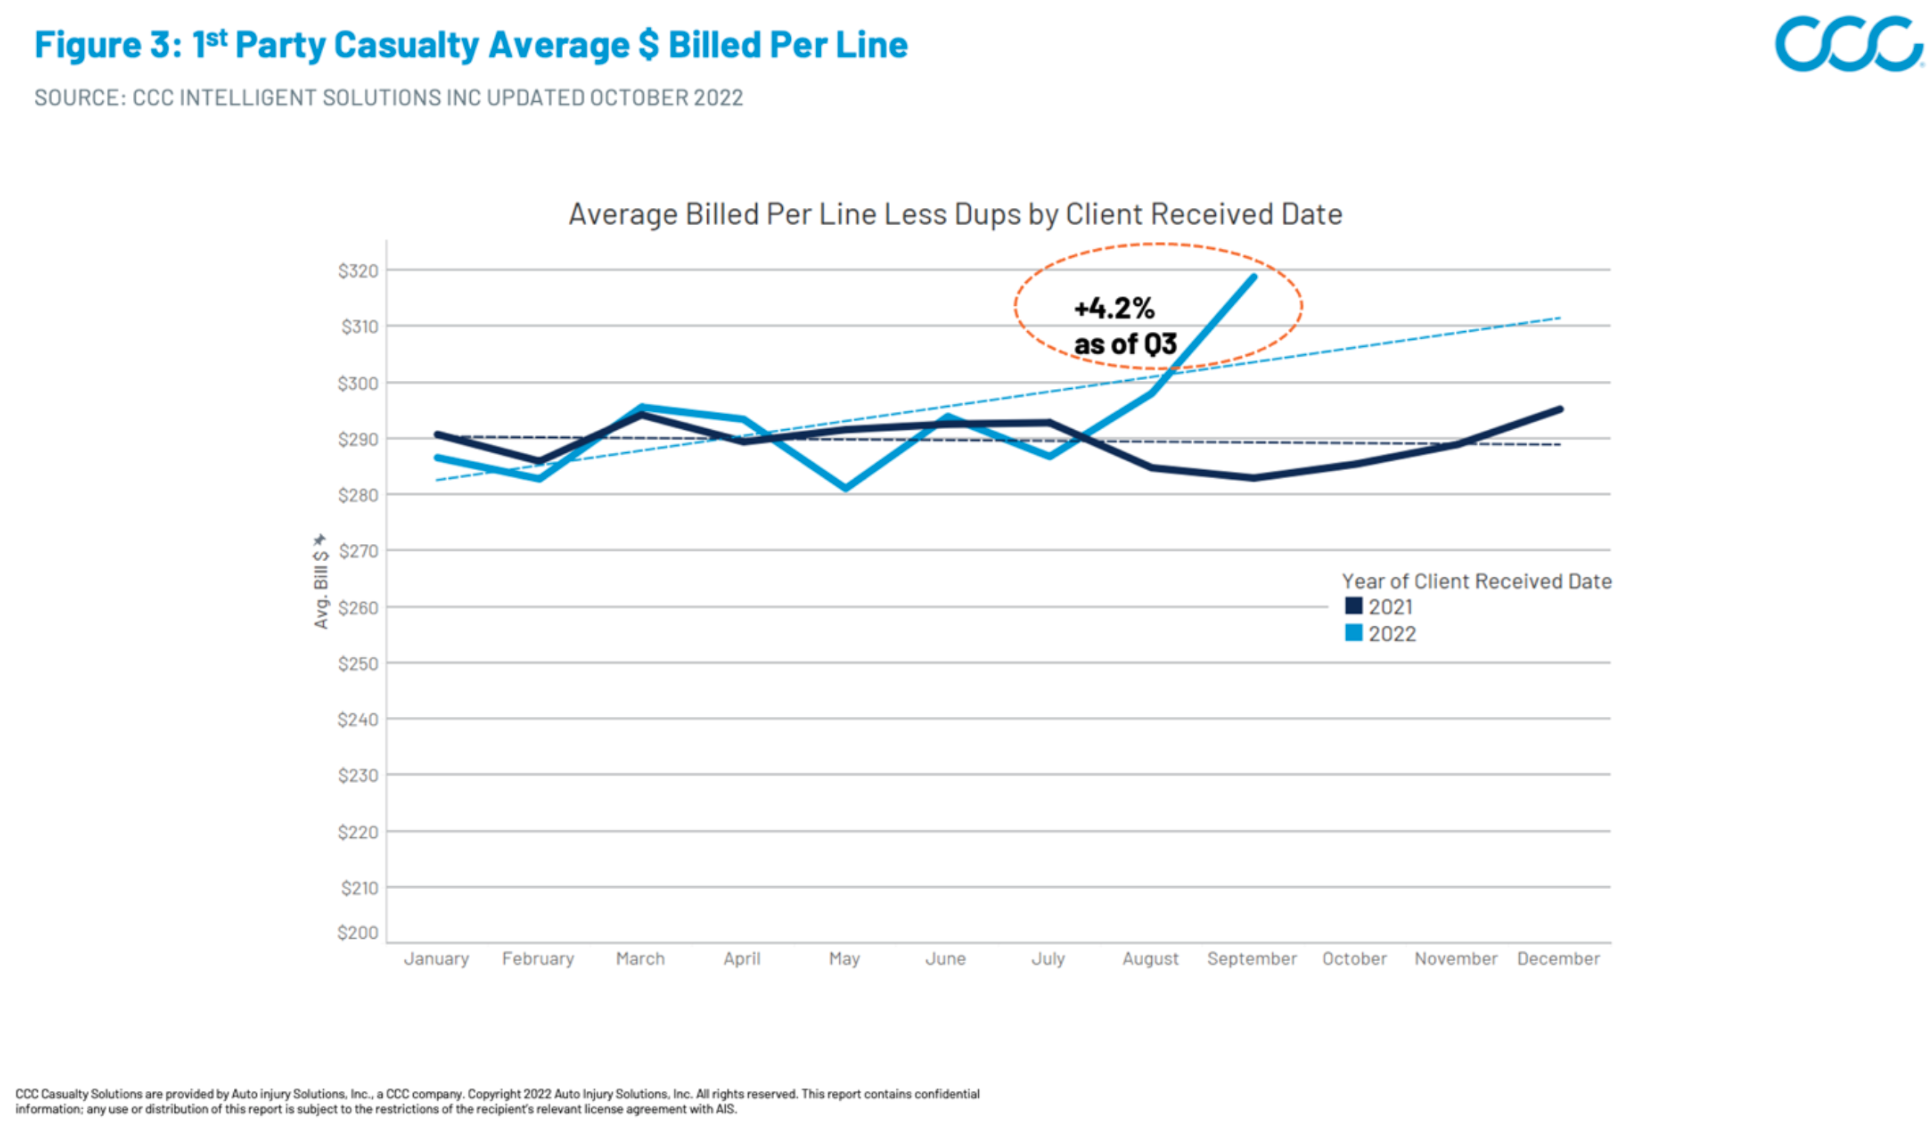
Figure 4: 3rd Party Casualty Average Considered (Billed less Duplicates) Per Line
Benchmarking to Level the Playing Field
Given the accelerating medical care inflation challenges, it is now more important than ever for auto insurers to leverage benchmarks when evaluating reasonableness of charges, as well as to have them readily accessible to the adjuster. This is easiest in states regulated via mandatory fee schedules, such as Pennsylvania or Oregon, but most states do not use a fee schedule. One option is the use of Fair Health, which maintains a large database of all charged amounts by procedure and geo ZIP code. While effective, a drawback of using methodology based on charge amount is that rapidly rising prices in a region will also drive up associated benchmark values.
Another excellent benchmarking option is the use of Medicare reimbursement schedules. As the single largest payer of medical bills in the U.S., Medicare is well-known to medical providers. It is extremely useful to reference the amount Medicare has agreed to pay for any given procedure by state venue. Because this benchmarking methodology is based on reimbursement versus charge, it is less affected by rapid charge increases.
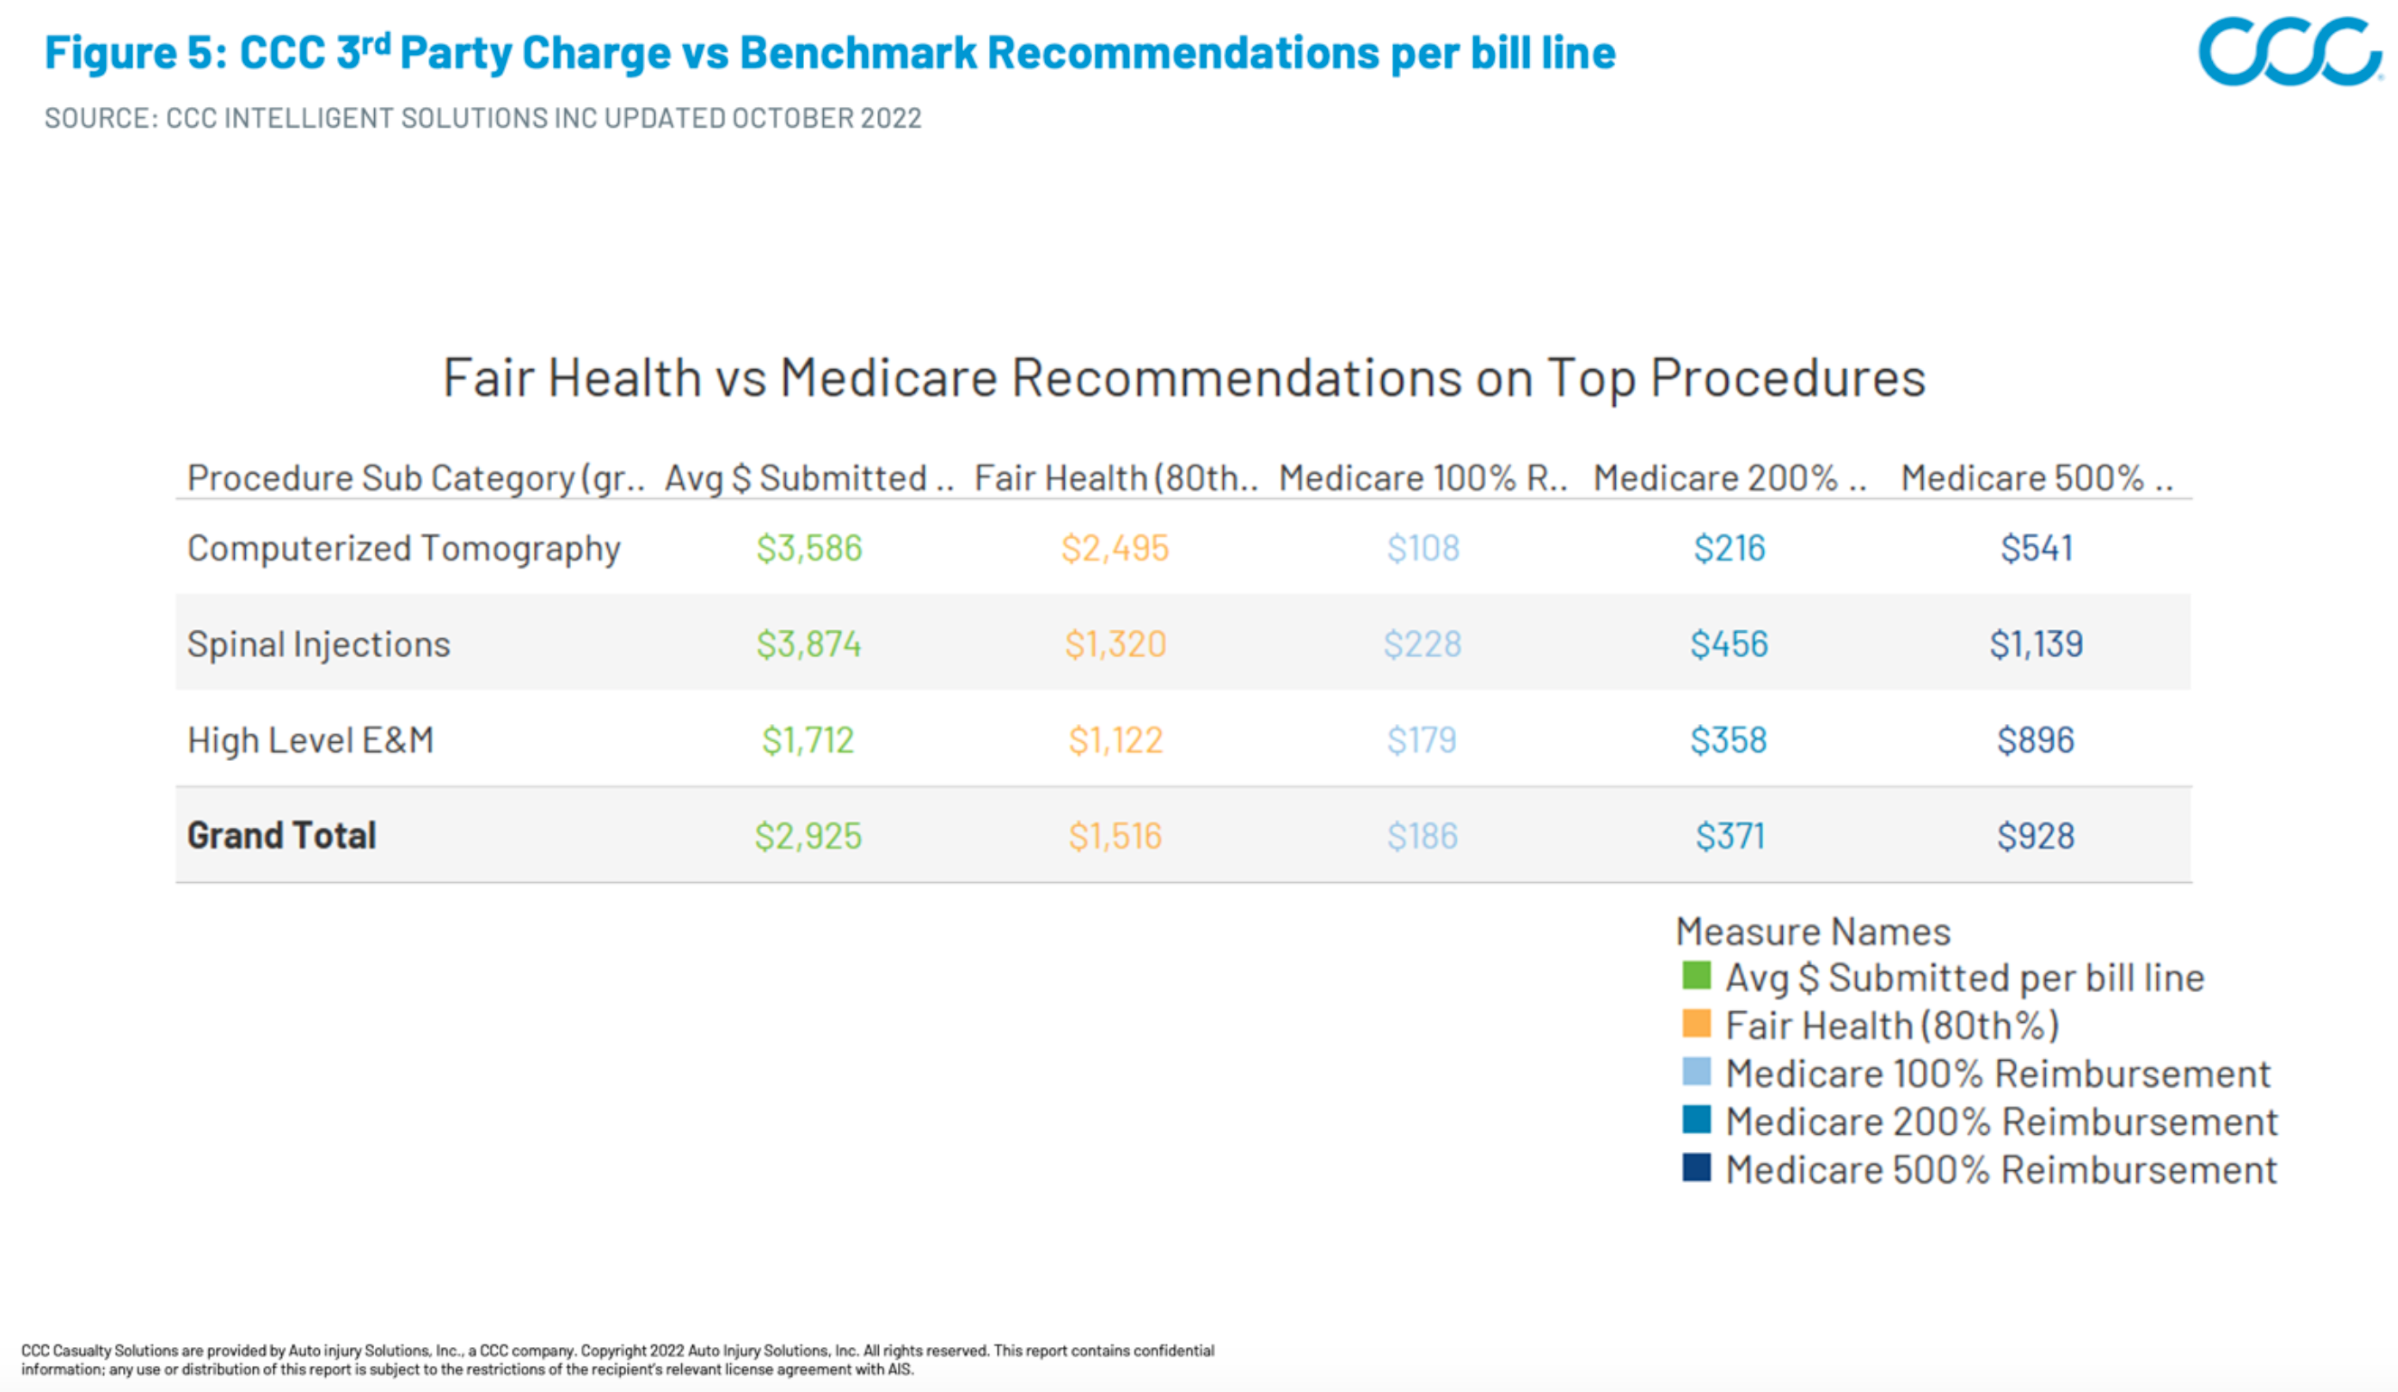
To better understand these differences in methodology, let’s use CCC billing data to examine the charge and recommendation values for some typical procedures that have already seen notable cost inflation (Figure 5). With a Fair Health benchmark configured at the 80th percentile for the procedure in the applicable ZIP code, the average reimbursement recommendation lands at 52% of the submitted amount. The Medicare benchmark value lands at just 6% of that same submitted amount. Even at 5x the Medicare reimbursement, the benchmark value lands at 32% of the submitted amount.
See also: Social Inflation: A Claims Perspective (Part 4)
Figure 5: CCC Charge vs Benchmark Recommendations
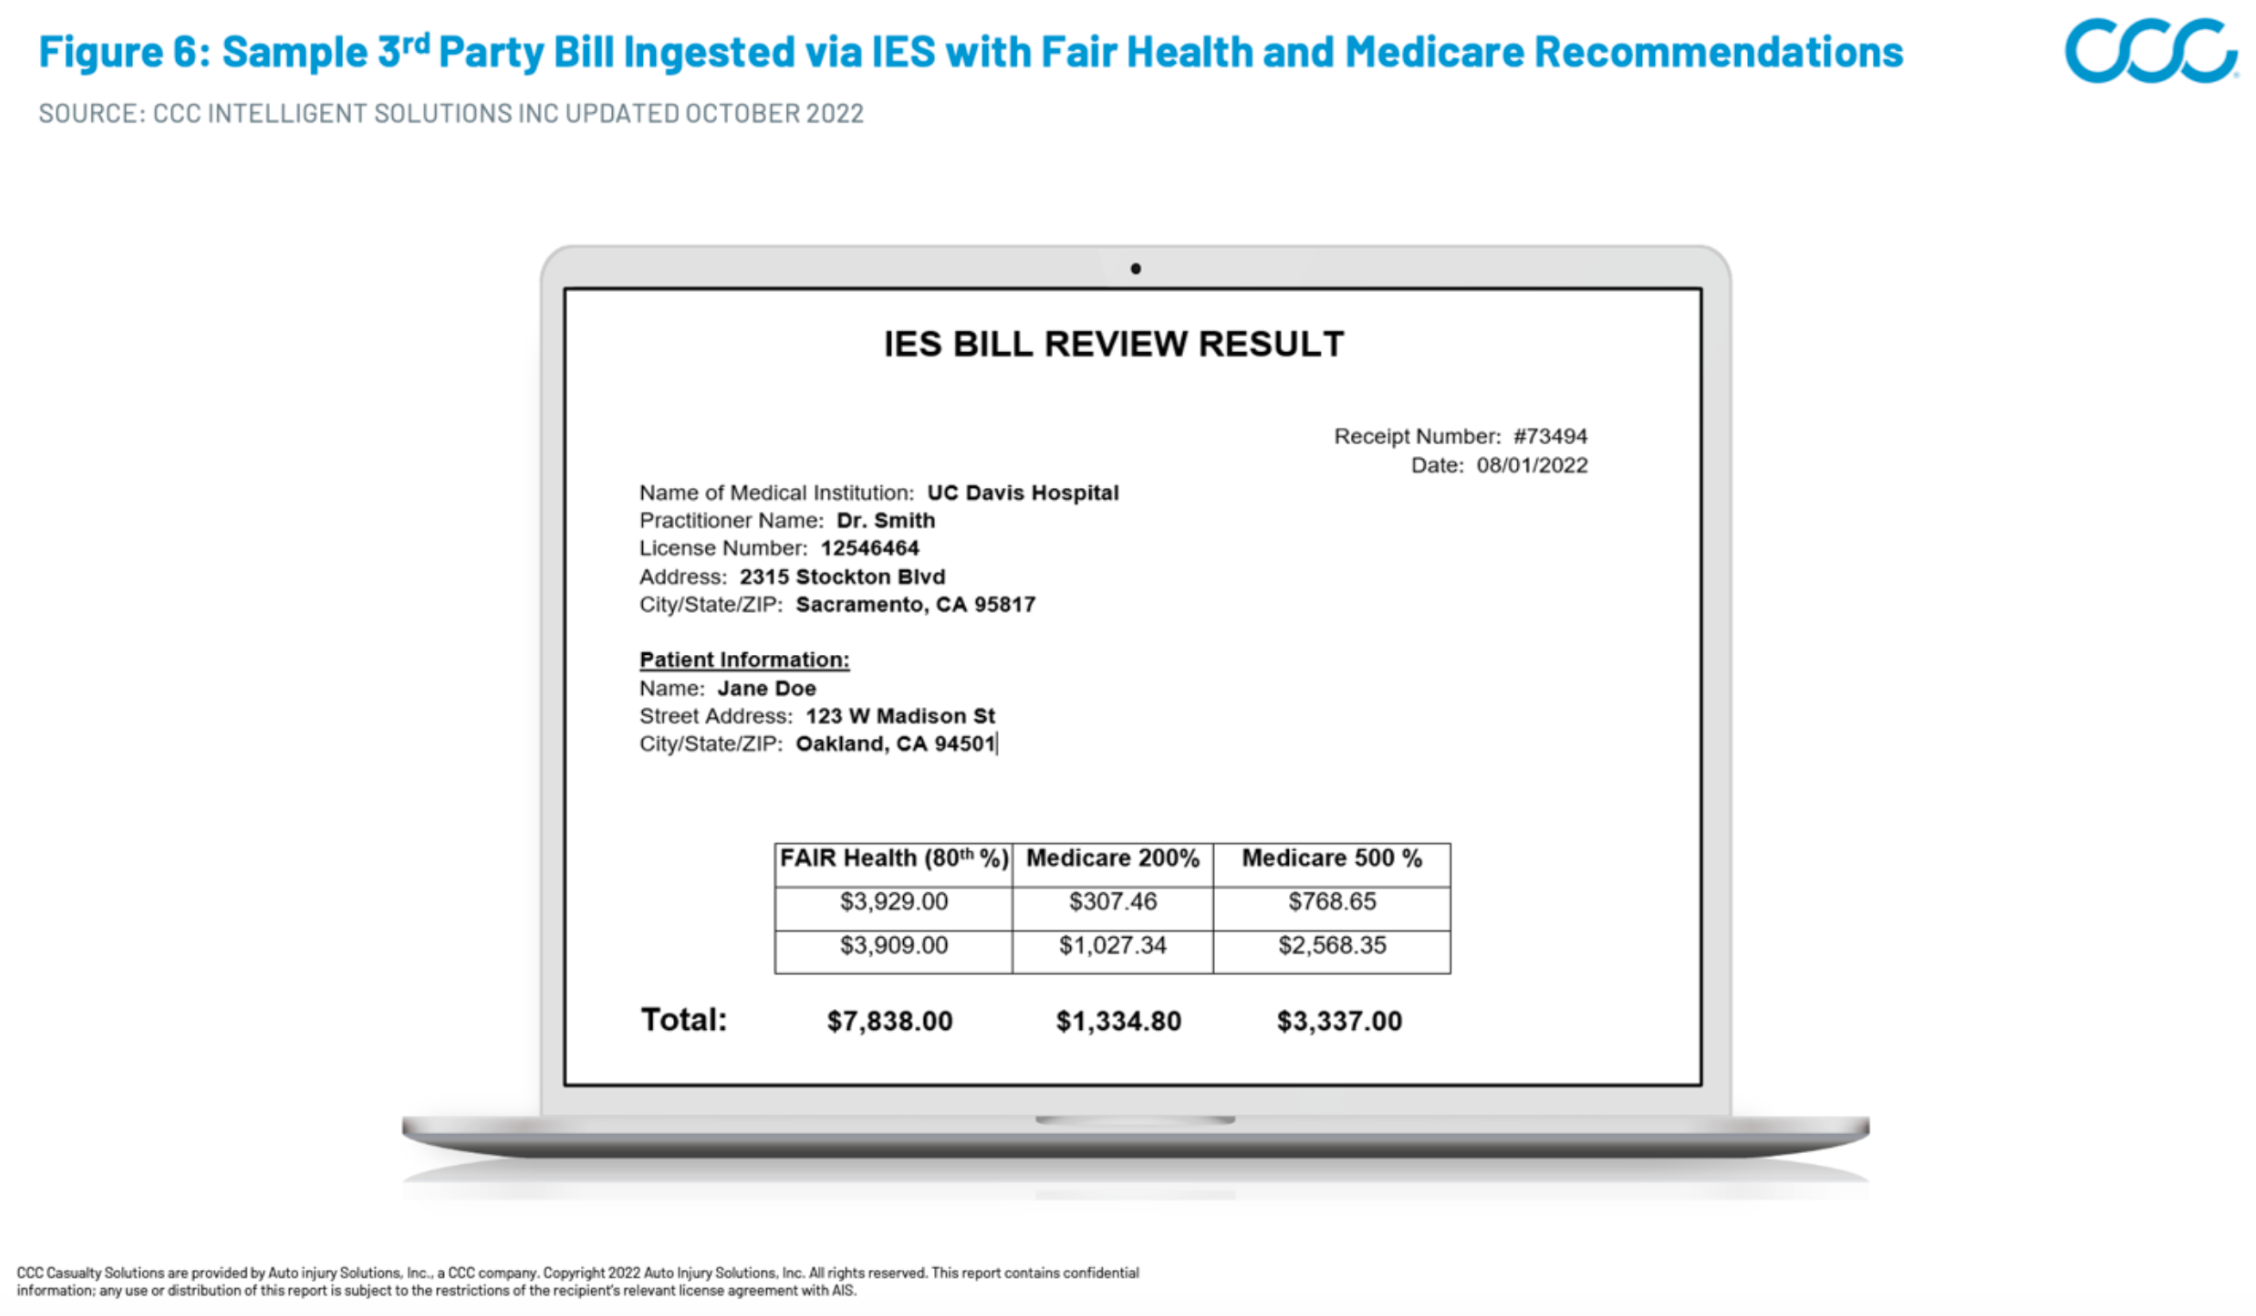
These benchmark values are most useful for third-party liability negotiations when integrated into medical bill review applications and supported by robust configuration options. With CCC’s 3rd Party Bill Review Application Injury Evaluation Solutions (IES), insurers can cascade and display multiple benchmark methodologies while also setting rule configurations such as Medicare multipliers by venue or bill type. The adjusters can review all available benchmarks and adjust as a batch or all the way down to bill line level as needed based on the right fit for the claim (Figure 6)
Figure 6: Sample Bill Ingested via IES with Fair Health and Medicare Recommendation Values
Medical inflation is here, escalating quickly, and likely to persist for an extended period based on historical indicators. Insurers who have integrated a comprehensive, consistent, easy-to-use benchmarking strategy into their workflow will be best-equipped to indemnify their casualty claims.

